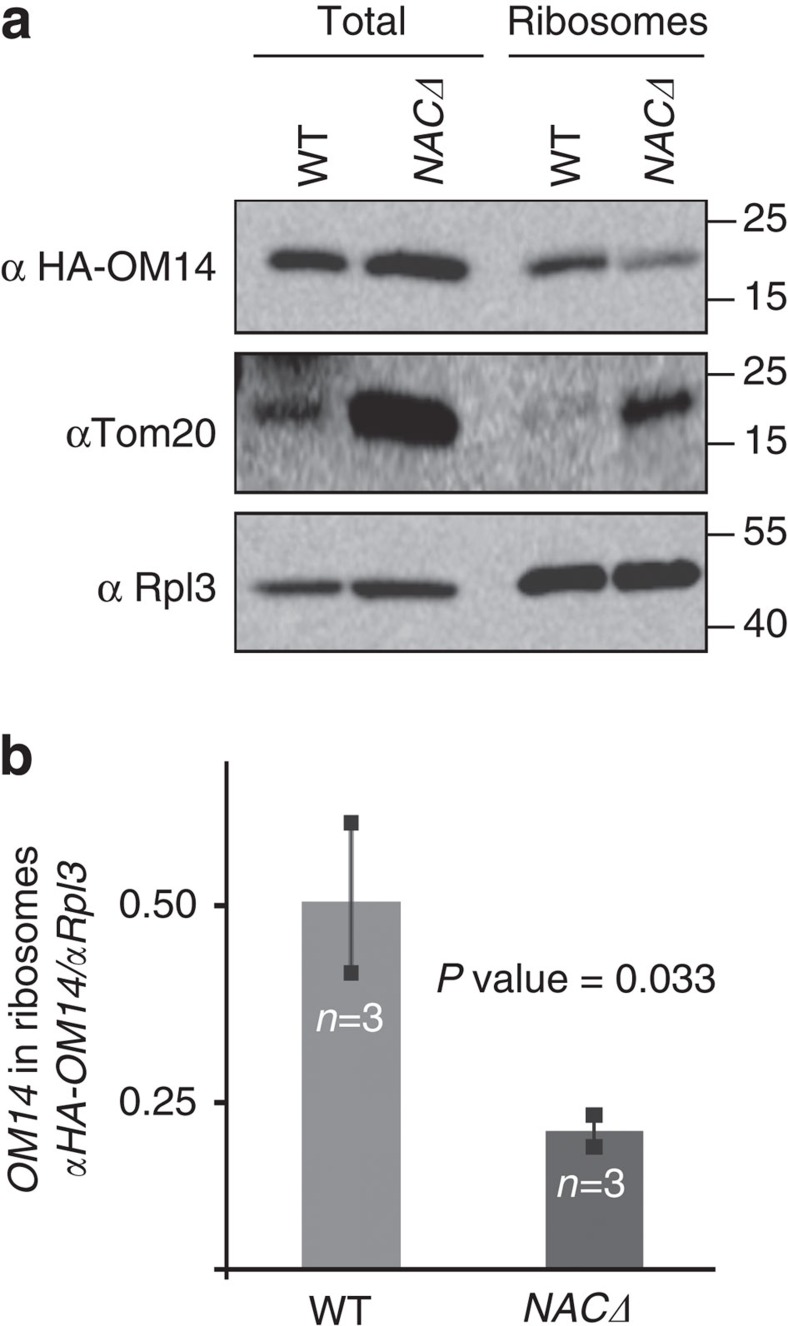
Figure 3. Lower OM14 association with NACΔ ribosomes.
Ribosomes were isolated from cells either expressing or deleted of NAC genes. A sample before isolation (total) or after centrifugation steps (ribosomes) was analysed by western analysis with the indicated antibodies. The histogram presents the average ratio of signals from several independent biological repeats (n) each entailing the entire procedure, from cells’ growth to western analysis. Error bars represent s.e.m. P value was calculated by independent-samples one-sided t-test. Normal distribution was verified by standard tests (either Shapiro–Wilk or Kolmogrov–Smirnov).

