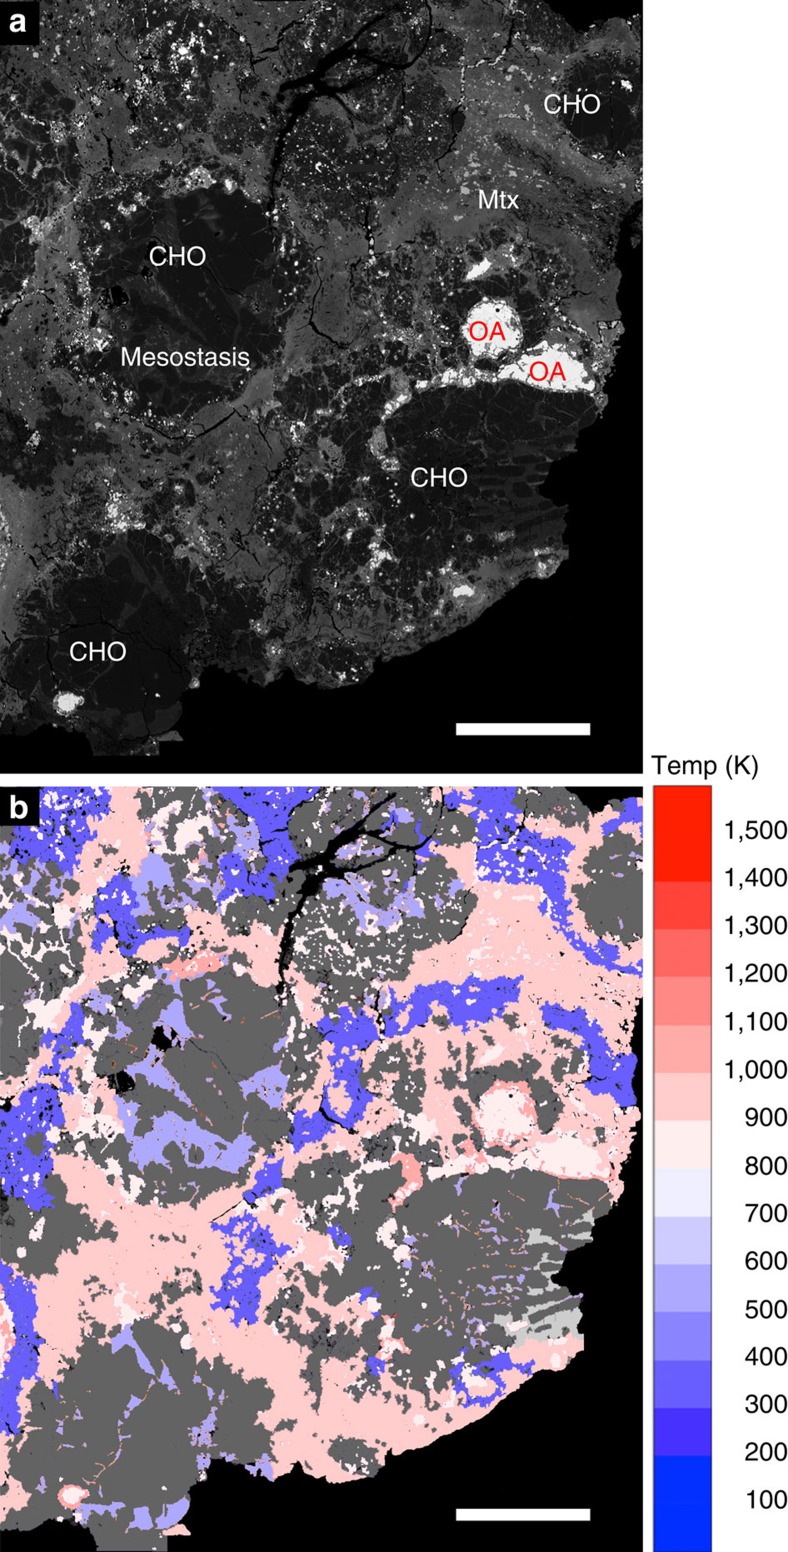
Figure 2. Back-scattered electron (BSE) and temperature images of CR2 chondrite GRA 06100.
(a) BSE image showing chondrules (CHO), mesostasis, opaque assemblages (OA) and matrix (Mtx). (b) Temperature map of the same area. Scale bar, 0.5 mm. Chondrule olivines (gray-scale regions) show no evidence of heating or shock. Temperatures were estimated based on the crystallographic transitions of aliettite (423, 493, 878 and 1,178 K)24; presence of near-end member ankerite (T>1,100 K)25; thermal decomposition of pentlandite (T>873 K)27; scorzalite–lazulite solid solution (T>758 K)26.

