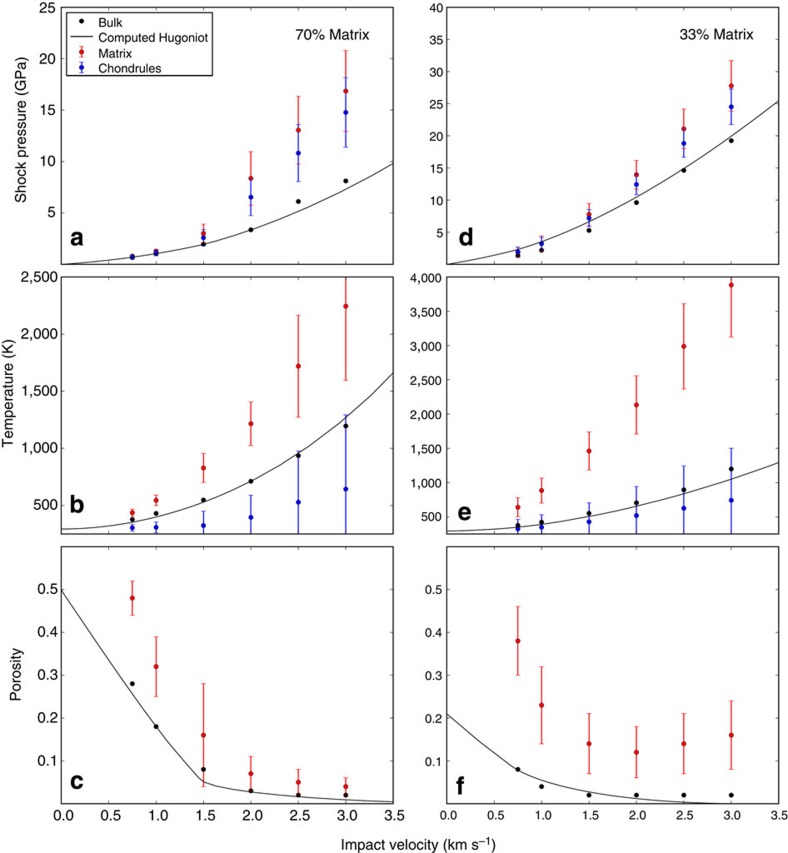
Figure 7. Pressure, temperature and porosity in mesoscale simulations.
Shock pressure (a,d), post-shock temperature (b,e) and post-shock porosity (c,f) as a function of impact velocity for bimodal chondrule/matrix mixtures with matrix volume fraction 70% (a–c) and 33% (d–f). Black symbols show bulk values of the state quantity, averaged over the entire sample region; red and blue symbols (and error bars) show mean (and s.d.) of the state variable in the matrix and chondrule fraction, respectively. Apart from the peak-shock pressures in the matrix and chondrules, which represent the maximum pressure recorded by the material at any time, all variables are measured at a given instant in time either during the shock passage (bulk pressure) or after release (final temperature and porosity). As a result, while the bulk porosity and final temperature values represent volume-weighted averages of the porosity and temperature of the matrix and chondrules components, the bulk shock pressure values are substantially less than the peak-shock pressures recorded by matrix and chondrules. Solid line shows a Hugoniot curve for the bulk porous material (0.49 for 70% matrix; 0.23 for 33% matrix) computed using the epsilon–alpha porous compaction model.

