Figure 3.

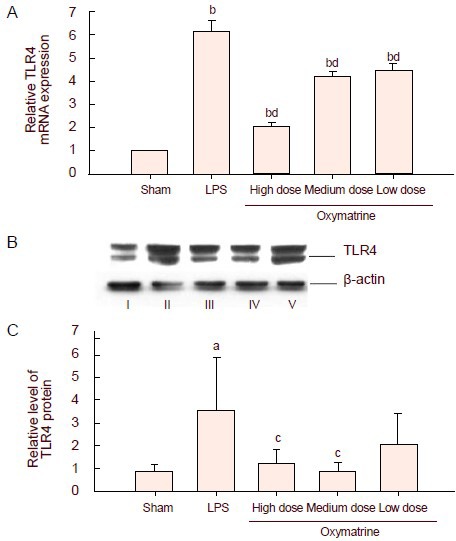
Effect of different doses of oxymatrine on lipopolysaccharide (LPS)-induced production of toll-like receptor 4 (TLR4) mRNA and protein.
(A) The mRNA expression of TLR4 in the hippocampus was tested by real-time quantitative PCR. Data were plotted as relative quantity (RQ, RQ=2-ΔΔCT). The expression of the target gene in the sham-operated group was standardized to one, and the RQ values of the other groups represent the fold changes compared with the sham-operated group.
(B) Representative western blot analysis of TLR4 protein (89-kDa) in the cerebral cortex of the different groups. β-actin (43-kDa) was used as a control. I–V: Sham, LPS, high, medium, low dose oxymatrine groups, respectively.
(C) Graph showing changes in the levels of TLR 4 in the different groups.
Data are expressed as mean ± SD (A, RQ; B, ratio of the absorbance value of TLR 4 to that of β-actin), there are three rats in each group. aP < 0.05, bP < 0.01, vs. sham-operated (Sham) group; cP < 0.05, dP < 0.01, vs. LPS group, by one-way analysis of variance followed by a Scheffé test.
