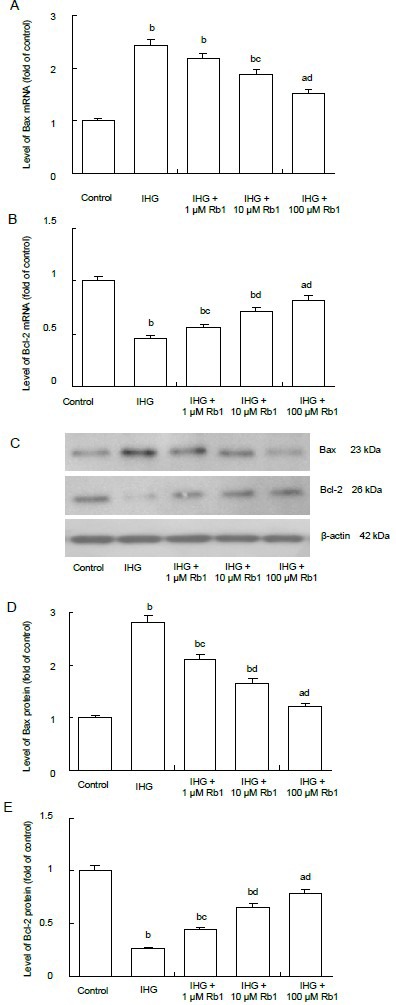
Figure 5.

Effect of ginsenoside Rb1 on mRNA and protein expressions of Bax and Bcl-2 in Schwann cells treated with intermittent high glucose.
mRNA and protein expression levels were determined by quantitative real-time reverse transcription-PCR (A, B) and western blot assays (C–E), respectively. GAPDH (for mRNA) and β-actin (for protein) was used as reference.
Data are expressed as mean ± SEM for each group of cells based on three separate experiments, and the value of the control cells was designated as 1. aP < 0.05, bP < 0.01, vs. control group; cP < 0.05, dP < 0.01, vs. intermittent high glucose (IHG) group (one-way analysis of variance followed by Student-Newman-Keuls test).
