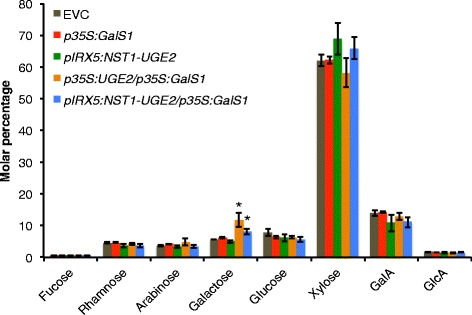
Figure 5.

Cell wall monosaccharide composition analysis of stems from plants co-overexpressing At UGE2 and GalS1. The monosaccharide composition of stems from plants in the T3 generation expressing either p35S:GalS1 or pIRX5:NST1-UGE2 or co-overexpressing either pIRX5:NST1-UGE2/p35S:GalS1 or p35S:UGE2/p35S:GalS1 was determined. Monosaccharide levels are shown as molar percentage ± SD (n = 5). Significantly increased levels of galactose (p ≤ 0.01, indicated with asterisks) were found with the two co-expressing constructs pIRX5:NST1-UGE2/p35S:GalS1 and p35S:UGE2/p35S:GalS1, while no other sugars were different from empty vector control plants (EVC) in any of the transgenic plants (p > 0.05). Analysis in the T2 generation of three independent lines for each construct showed the same results. The data were analyzed by pairwise t-test with Holm-Bonferroni correction for family-wise error rate. GalA, α-d-galacturonic acid; GlcA, α-d-glucuronic acid.
