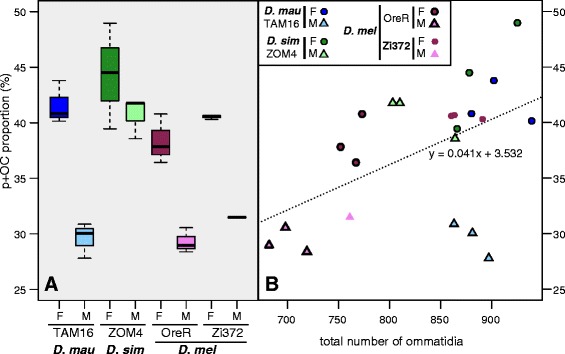
Figure 2.

Variation in the relative proportion of p + OC ommatidia. A. Boxplots of the percentage of p and OC ommatidia combined, relative to the total of non-DRA ommatidia (y and Dy), specified for strain and species. B. Scatterplot of the same statistic as in A, derived from the same 22 retinas, as a function of the total number of ommatidia, specified for strain and species. D. mau, D. mauritiana; D. sim, D. simulans; D. mel, D. melanogaster; F, female; M, male.
