
Figure 4.
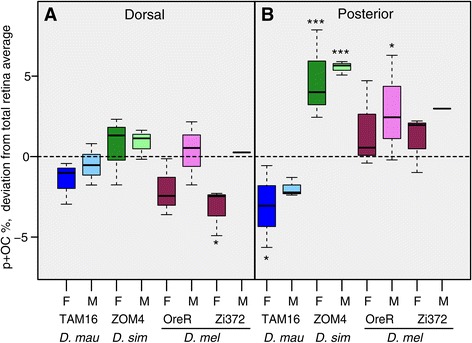
Variation in the proportion of p + OC ommatidia in the dorsal and anterior retina. Boxplots showing, per strain and per sex, the percentage of p and OC combined, relative to the total of non-DRA ommatidia in A the dorsal retina and B the anterior retina. Values in both panels are expressed as the deviation from the percentage of the total retina. Hence, the inverse of the values in A give the deviation in the ventral retina, and the inverse of the values in B the deviation in the posterior retina. Asterisks indicate level of significance (see main text).