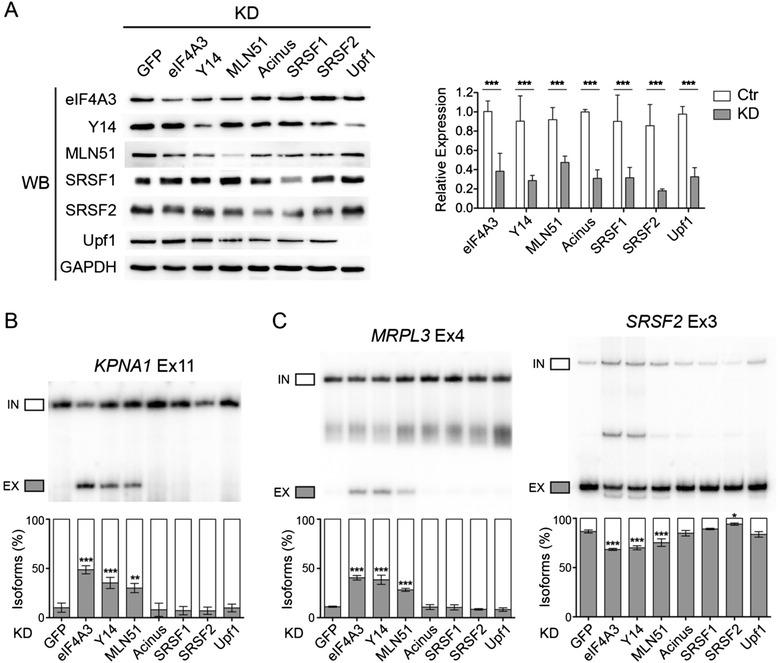
Figure 3.

EJC-dependent splicing changes are specific to EJC core protein. (A) Western blot (left) and qPCR (right) showing the KD efficiency of EJC core proteins as well as EJC associated protein Acinus, and SR proteins SRSF1 and SRSF2. GAPDH is used as a control. (B,C) RT-PCR of splicing patterns of representative constitutive exons (B) and alternative exons (C) in different KD conditions. The quantification of triplicate experiments are shown below as mean ± SD. *P < 0.05; **P < 0.01; ***P < 0.001, one-way ANOVA.
