
Figure 1.
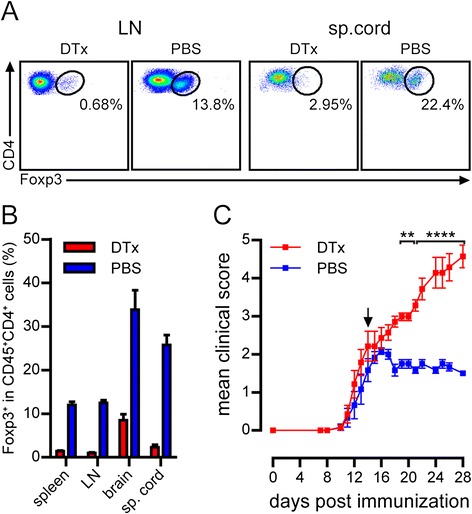
Exacerbation of EAE after acute T reg depletion at the peak of the disease. Representative flow cytometry plots (A) or mean frequency (± SEM) of Foxp3+ in CD45+CD4+ T cells (B) isolated from indicated organs of DEREG mice two days after DTx or PBS treatment are shown (n = 11 mice per group, pooled data from four independent experiments). (C) Mean clinical score (± SEM) of mice following immunization and DTx or PBS treatment (day 4 post EAE onset). (n = 6-7 mice per group, representative data from two independent experiments. **P < 0.01, ****P < 0.0001, 2way ANOVA).