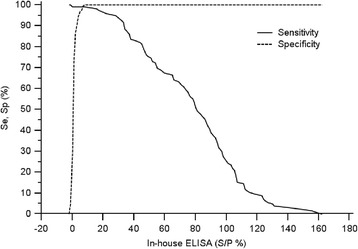
Figure 3.

TG-ROC curve. The curves show the sensitivity and specificity relative to VNT at different cut-off values (S/P%) of the in-house ELISA. All of three hundred VNT negative and 123 positive bovine, caprine and ovine sera (see Table 1) were used for analysis. Within the range of S/P 8% to 15% the analysis gives a sensitivity of 99.19% and a specificity of 100%.
