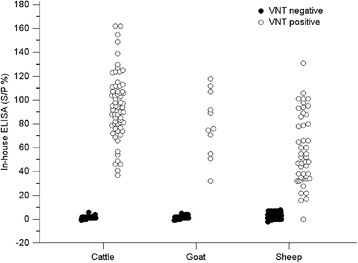
Figure 4.

The dot plot graph illustrates the distribution of ELISA S/P% values relative to virus neutralizing test (VNT) antibody titers. Three hundred VNT negative and 125 VNT positive bovine, caprine and ovine sera (see Table 1) were included in the analysis. The S/P values of the negative bovine sera varied from −1 to 6 and the positive sera from 37 to 162. The S/P values of the negative caprine sera varied from −2 to 5 and the positive sera from 32 to 118. The S/P values of negative ovine sera ranged from −2 to 8 and the positive sera from 16 to 131. One VNT positive ovine sera got an S/P value of 0.
