
Figure 4.
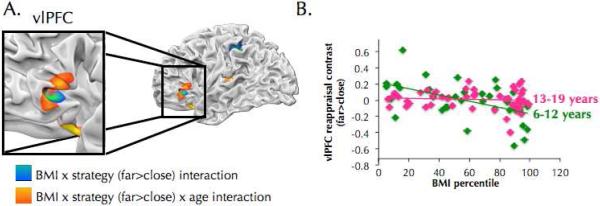
Brain regions where BMI predicts brain activity as a function of strategy and/or age. (A) BMI x strategy (Far > Close) interaction is shown in cool colors. Heavier individuals recruited left vlPFC and parietal cortex to a lesser degree than leaner individuals during regulation of craving (Far > Close). Results of BMI x strategy x age interaction are shown in warm colors. BMI predicted less reappraisal-related recruitment at younger ages than at older ages. The results of these two analyses intersect in left vlPFC (MNI coordinates: −42, 30, 0; 20 voxels). (B) For illustrative purposes, the data from the BMI x strategy x age interaction in left vlPFC are plotted here (MNI coordinates: −54, 33, −12; shown in 4A). Contrast values for Far > Close are plotted on the y axis with BMI percentile on the x axis. Age was analyzed continuously but for ease of interpretation, age is shown split into two groups to highlight that BMI predicted less vlPFC recruitment during reappraisal in younger individuals, but not in older individuals.