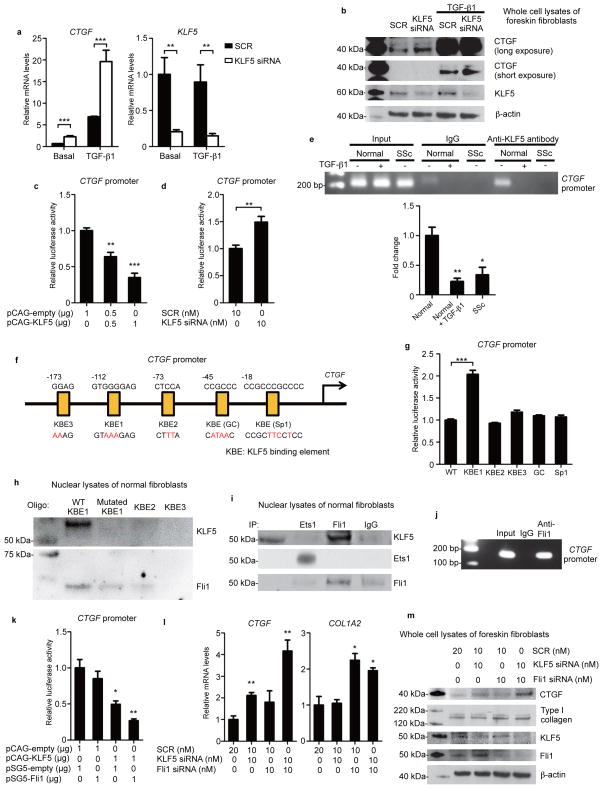
Figure 3. KLF5 and Fli1 coordinately repress CTGF transcription.
(a,b) Foreskin fibroblasts were transfected with scrambled control RNA (SCR) or KLF5 siRNA for 24 hours and stimulated with TGF-β1 (2 ng/ml) for an additional 24 hours under serum starvation. Expression levels were assessed by qRT-PCR (a) and immunoblotting (b). (c,d) Luciferase assays using CTGF promoter constructs. Foreskin fibroblasts were cotransfected with indicated vectors (c), or with SCR or KLF5 siRNA (d). Thirty hours after transfection, luciferase activity was measured. (e) Chromatin immunoprecipitation on fibroblasts was performed using anti-KLF5 antibodies and primers specific for the KLF5-binding site on the CTGF promoter. The results of qRT-PCR normalized to input values are summarized. n = 4 individuals per group. (f) Putative KLF5 binding sites on the CTGF promoter and mutated sequences (red letters). KBE, KLF5-binding element. (g) Luciferase assays performed as in c using mutated promoter constructs. (h) Oligonucleotide pull-down assays using oligonucleotides containing KBE1 with or without mutation, KBE2, and KBE3. Input corresponds with fibroblast nuclear lysates before oligonucleotide binding. Oligo, oligonucleotides. (i) Fibroblast nuclear extracts were immunoprecipitated and blotted with indicated antibodies. IP, immunoprecipitation. (j) Chromatin immunoprecipitation on fibroblasts was performed using anti-Fli1 antibodies and primers specific for the KLF5 binding site on the CTGF promoter. (k) Luciferase assays performed as in c. (l, m) Fibroblasts were treated with SCR or indicated siRNA for 24 hours and serum-starved for 24 hours. mRNA levels (l) and protein levels (m) were assessed. Data are mean ± s.e.m. of 3 independent experiments. Blotting results are representatives of three independent experiments. *P < 0.05, **P < 0.01, ***P < 0.001 by two-tailed unpaired t-test. Significant differences in c,e,g,k,l are compared to the leftmost group.

