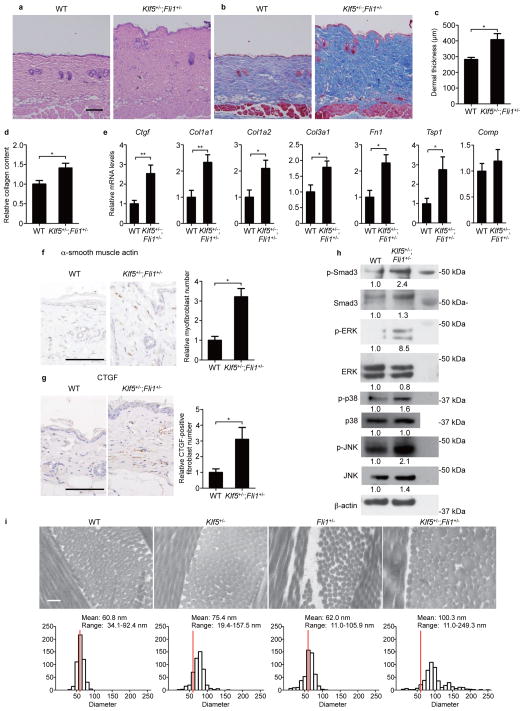
Figure 5. Klf5+/−;Fli1+/− mice spontaneously develop dermal fibrosis.
Skin histology in 3-month-old male mice with hematoxylin and eosin staining (a) and Masson’s trichrome staining (b). Scale bar, 100 μm. (c) Dermal thickness is summarized. n = 7 male mice per group. (d) Relative skin collagen content. n = 8 mice per group. (e) mRNA levels of extracellular matrix proteins in the skin are assessed by qRT-PCR. n = 8 mice per group. (f,g) The relative numbers of myofibroblasts (f) and connective tissue growth factor (CTGF)-positive fibroblasts (g). n = 5 mice per group. Scale bar, 100 μm. (h) Immunoblotting for molecules related to canonical and non-canonical TGF-β pathways in dermal fibroblasts. Relative densitometric values are shown below the bands. (i) Collagen fibril alignment in the superficial dermis was examined by transmission electron microscopy. Scale bar, 200 nm. Frequency distribution profiles were obtained by measuring 500 collagen fibrils. Red bars show the diameter most frequently seen in WT mice. Data are mean ± s.e.m. *P < 0.05, **P < 0.01 by two-tailed Mann-Whitney U test.

