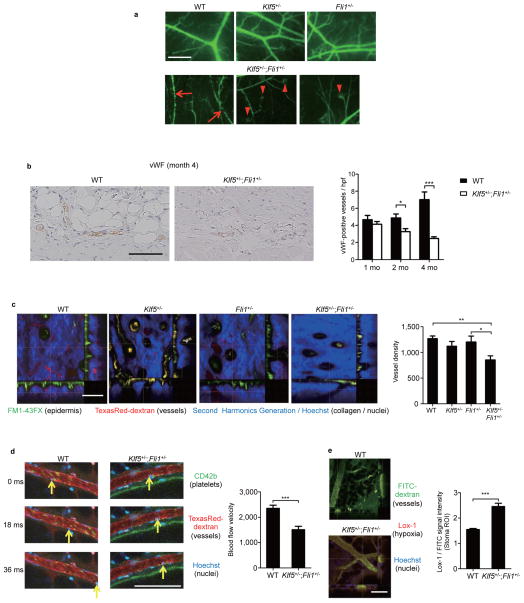
Figure 6. Klf5+/−;Fli1+/− mice demonstrate vascular abnormalities in the skin.
(a) Cutaneous vasculature visualized by FITC-conjugated dextran in 2-month-old-mice. Arrows show vascular stenosis and arrowheads demonstrate bushy capillary tips. Scale bar, 300 μm. The representative images from n = 4 mice per group. (b) The number of subcutaneous vessels was determined by von Willebrand factor (vWF) staining. Representative images are shown. Scale bar, 100 μm. n = 15 high power fields (hpf) from 3 mice per time point. (c,d,e) In vivo imaging visualizes the skin of 4-month-old male mice with indicated three colors. (c) Horizontal sections and longitudinal sections of dermis. Vessel density is quantified. n = 20 fields from 4 mice per group. Scale bar, 100 μm. (d) Cutaneous arterioles. The arrows show flowing leukocytes at every 18 millisecond interval. Arteriolar blood velocities are calculated. n = 15 fields from 3 mice per group. Scale bar, 100 μm. (e) Interstitial hypoxia measured by hypoxia probe (Lox-1) in 4-month-old-mice. n = 20 fields from 4 mice per group. Scale bar, 100 μm. Data are mean ± s.e.m. *P < 0.05, **P < 0.01, ***P < 0.001 by two-tailed Mann-Whitney U test except for c with one-way ANOVA with Bonferroni’s post hoc test.

