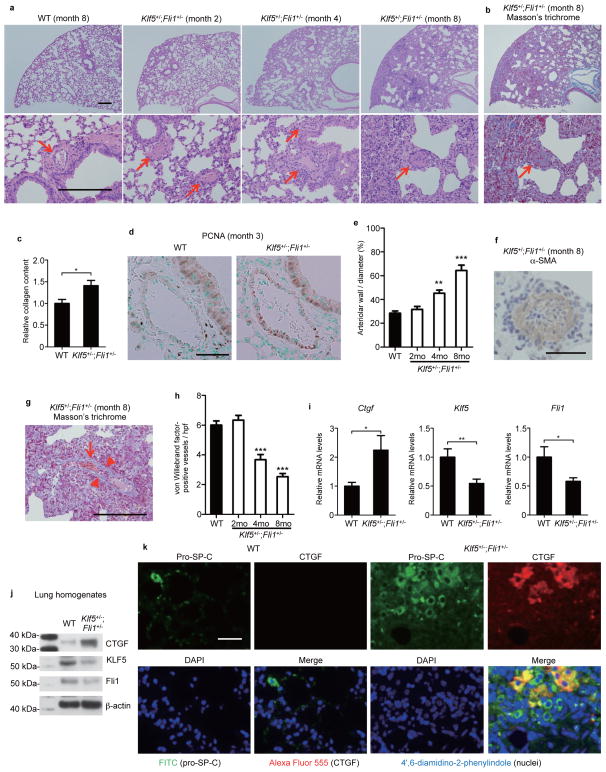
Figure 7. Klf5+/−;Fli1+/− mice demonstrate interstitial lung fibrosis and vascular occlusions.
(a) Lung histopathology with hematoxylin and eosin staining (a) and Masson’s trichrome staining (b). Scale bar, 200 μm. Arrows show bronchiolar arterioles. (c) Relative lung collagen content. n = 4 mice per group. (d) Proliferating cell nuclear antigen (PCNA) staining of bronchiolar arterioles in WT and Klf5+/−;Fli1+/− mice. Scale bar, 50 μm. A: arteriole. B: bronchiole. (e) Quantification of arteriolar stenosis. n = 15 vessels from 3 mice per time point. (f) The representative occluded bronchiolar arterioles in 8-month-old Klf5+/−;Fli1+/− mice with α-smooth muscle actin (α-SMA) staining. Scale bar, 50 μm. (g) The representative interseptal venule of 8-month-old Klf5+/−;Fli1+/− mice with Masson’s trichrome staining. Arrowheads show luminal narrowing. An arrow shows erythrocyte congestion. Scale bar, 200 μm. (h) The number of capillaries was determined by immunohistochemical staining for the endothelial cell marker, von Willebrand factor (vWF), in lung sections. n = 15 high power fields (hpf) from 3 mice per time point. (i) Ctgf, Klf5, and Fli1 mRNA levels in the lung were assessed by qRT-PCR. n = 9 mice per group. (j) Protein levels of CTGF, KLF5, and Fli1 in lung homogenates were assessed by immunoblotting. The results are from representative experiments that have been repeated 3 times in different pairs of mice with similar results. (k) Representative lung sections from 3 WT and 3 Klf5+/−;Fli1+/− mice are shown. Pro-surfactant protein C (pro-SP-C), a specific marker for type 2 alveolar cells, is stained with FITC (green). CTGF is stained with Alexa Flour 555 (red). Nuclei are stained with 4′,6-diamidino-2-phenylindole (DAPI, blue). Scale bar, 50 μm. Data are mean ± s.e.m. *P < 0.05, **P < 0.01, ***P < 0.001 by two-tailed Mann-Whitney U test. The significant differences in e,h are compared to WT groups.

