
Figure 3.
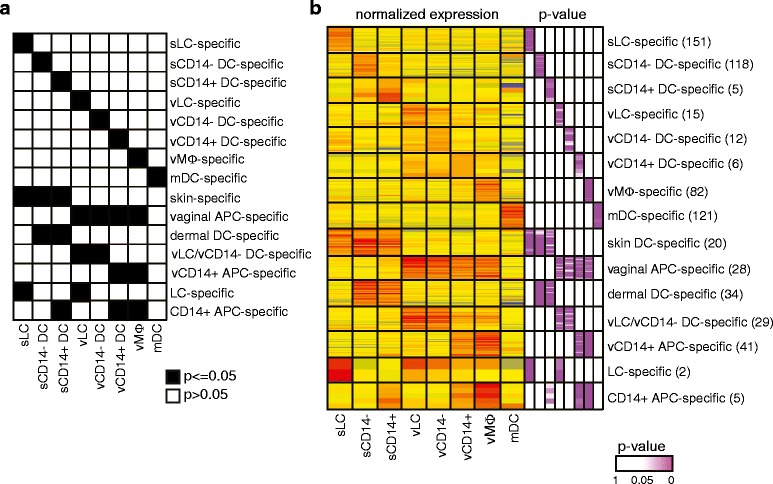
Analysis of variance identifies population-specific transcripts. (a) Heatmap describing the filtering method applied to identify population-specific transcripts. (b) Heatmap representing the normalized expression of transcripts specifically over-expressed in each APC population studied, as well as groups of populations or tissues. P-values are represented in purple gradient on the right.