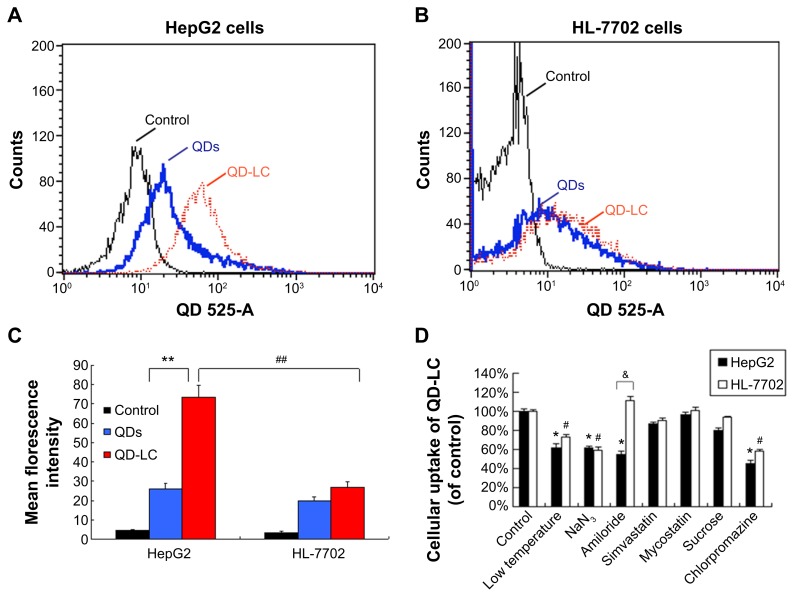
Figure 3.
Intracellular quantification of QD-LC in HepG2 and HL-7702 cells.
Notes: Fluorescence intensity of QDs or QD-LC in (A) HepG2 cells and (B) HL-7702 cells by FACS, using detecting channel 525-A. (C) Quantitative analysis of cellular uptake of QDs or QD-LC in HepG2 cells and HL-7702 cells. The data represent three separate experiments and are presented as mean values ± SD. **P<0.01 for mean fluorescence intensity of QDs versus QD-LC in HepG2 cells; #P<0.01 for mean fluorescence intensity of QD-LC in HepG2 cells versus in HL-7702 cells; ##P<0.01 for mean fluorescence intensity for HepG2 cells versus HL-7702 cells. (D) The endocytosis inhibition assay on HepG2 and HL-7702 cells. The data represent three separate experiments and are presented as mean values ± SD. *P<0.05 and #P<0.05 versus control group; &P<0.05 for HepG2 cells versus HL-7702 cells.
Abbreviations: FACS, fluorescence-activated cell sorting; QD, quantum dot; QD-LC, CdTe/CdS core/shell quantum dot–lipids complex; SD, standard deviation.

