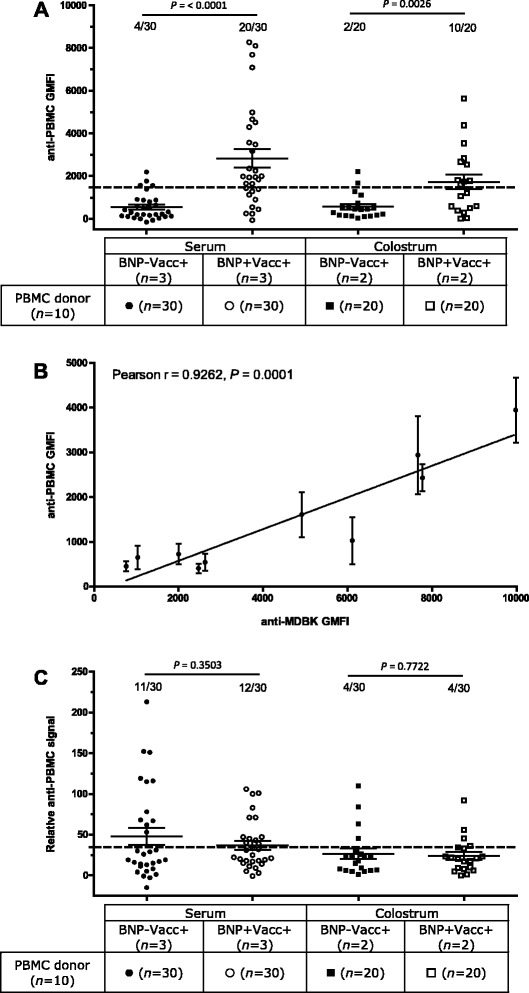
Figure 3.

Binding of peripheral blood mononuclear cells by alloantibodies from Pregsure© BVD vaccinated dams. A: Peripheral Blood Mononuclear Cells (PBMC) from ten random dams were stained with serum (n = 3) and colostrum (n = 2) of different Pregsure© BVD vaccinated non-BNP dams (BNP-Vacc+, n = 5) and with serum (n = 3) and colostrum (n = 2) of Pregsure© BVD vaccinated BNP dams (BNP + Vacc+, n = 5). IgG1 alloantibody binding was measured by flow cytometry. GMFI subtracted by isotype control is plotted on the y-axis. The horizontal dotted line depicts the overall average geometric mean fluorescent intensity (GMFI) and the number above the plots describes the number of samples with a signal above the horizontal line. B: Correlation between the average IgG1 alloantibody binding of PBMC’s from ten dams to IgG1 alloantibody binding of MDBK cells by serum or colostrum samples as in Figure 3A. C: The data from Figure 3A were divided by the GMFI signal of the alloantibody staining of MDBK cells by the respective serum or colostrum. The horizontal dotted line depicts the overall average relative signal and the number above the plots describes the number of samples with a signal above the horizontal line. Mean ± standard error of the mean is depicted in all graphs. Two tailed simple T-tests for unequal variance was used to compare serum or colostrum alloantibody binding of PBMC’s between Pregsure© BVD vaccinated non-BNP and BNP dams. Correlation was tested with Pearsons correlation. Normality was tested with D’Agostino and Pearsons omnibus normality test.
