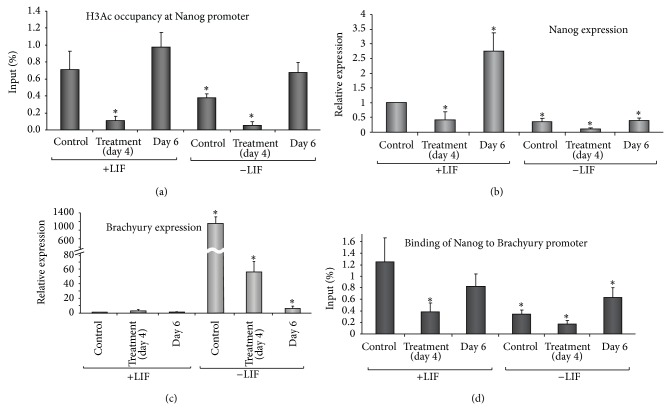
Figure 2.
Nanog reexpression during differentiation acts as a regulator of cell fate decisions (a) ChIP analysis shows relative levels of acetylated histone H3 occupancy at Nanog promoter following NO treatment. (b) Real-time PCR analysis of Nanog and (c) Brachyury expression levels before and after NO treatment. (d) ChIP analysis shows Nanog binding to Brachyury promoter following NO treatment. Histogram plots represent cells from control, NO treated (day 4), and 2 days after NO treatment (day 6) in the presence (left bars) or absence (right bars) of LIF, respectively. Data are mean ± SEM from 5 independent biological replicates. *Significant difference from undifferentiated control condition (+LIF).

