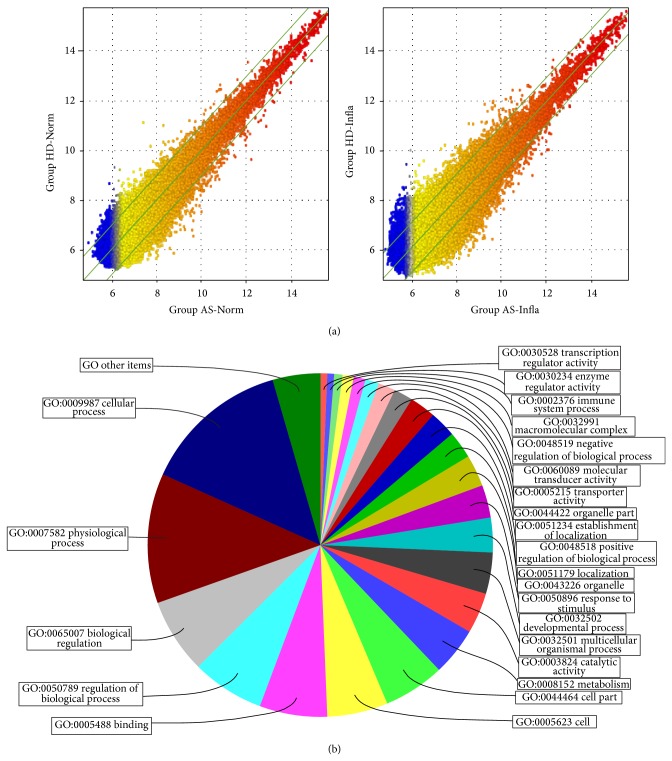
Figure 2.
Whole genomic expression analysis of MSCs in AS patients. (a) shows the scatter plot of differentially expressed genes of MSCs from both healthy donors and AS patients, respectively, in both normal and inflammatory culture environment. The values of x and y axes in the scatter plot are the normalized signal values of each sample (log2 scaled). The green lines are fold change lines (the default fold change value given is 2.0). Genes above the top green line and below the bottom green line indicated more than 2.0-fold change of genes between two compared arrays. (b) shows the pie chart of gene ontology (GO) analysis of results of the differentially expressed genes of MSCs between group AS-Infla and group HD-Infla. Among the 1590 genes, 892 (56.10%) participated in biological process, 461 (28.99%) played a role in molecular function, and 237 (14.91%) associated with cellular component.

