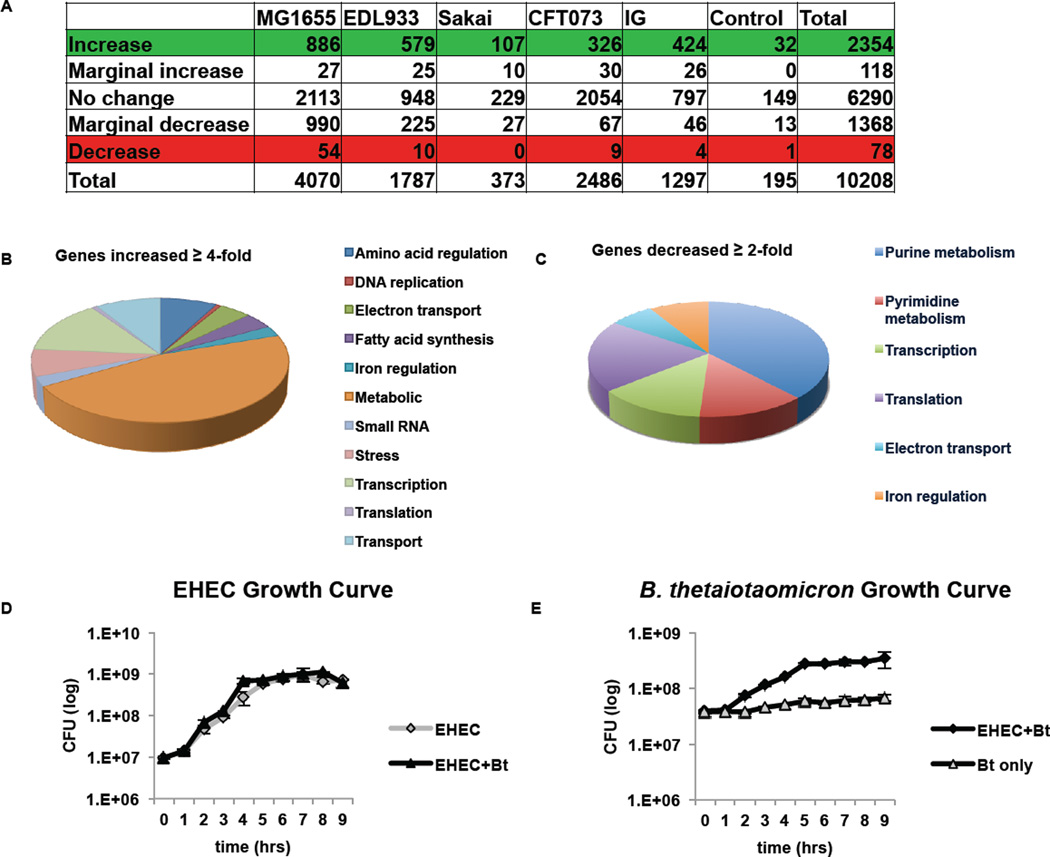
Figure 1. B. thetaiotaomicron (Bt) increases expression of one-fifth of the E. coli array probe sets.
A, Summary of microarray results comparing EHEC grown with Bt to EHEC grown alone (EHEC+Bt/EHEC only). B, C, Pie graph categorizing the E. coli genes by function b, that increased ≥ 4-fold or c, that decreased ≥ 2-fold in the presence of Bt D, E, Growth curves (of 6 biological samples, experiments were repeated 2 times, each with 3 independent biological samples) of in vitro growth of D, EHEC or E, Bt. The error bars indicate the standard deviation of the mean. Doubling time for EHEC grown alone and in the presence of Bt is 50 min/gen and 53 min/gen, respectively. Doubling time for Bt grown alone and in the presence of EHEC is 282 min/gen and 97 min/gen, respectively.

