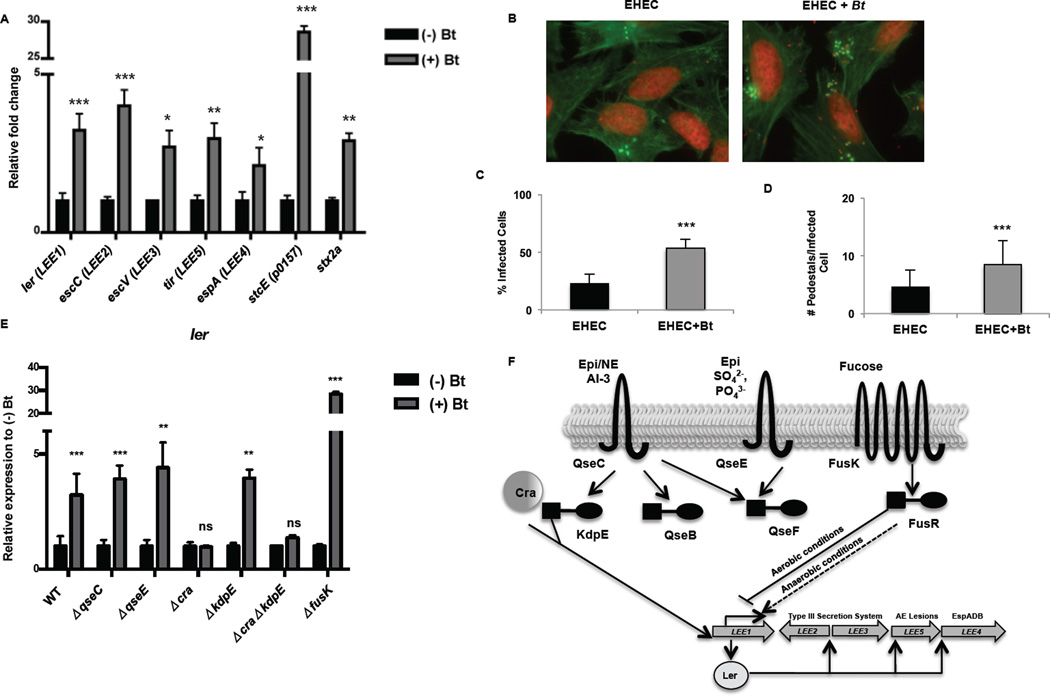
Figure 2. Bt augments EHEC virulence via the catabolite repressor/activator protein.
A, qRT-PCR of LEE, stcE and stx2A genes in EHEC grown alone (−) Bt or in the presence of Bt (+) Bt (n= 9; error bars, s.d.; ***P < 0.001, **P < 0.01, *P < 0.05). B, Fluorescent actin staining assay of HeLa cells infected with EHEC alone or in the presence of Bt, stained with fluorescein isothiocyanate-phalloidin (actin, green) and propidium iodide (bacterial and HeLa DNA, red). Original magnification, 63X. C, Quantification of fluorescent actin staining assay of the percentage of HeLa cells infected, as defined by pedestal formation by EHEC. D, Number of pedestals/infected cell. (n = 350 cells; error bars, s.d.; *** P<0.001). E, qRT-PCR of ler in WT, ΔqseC, ΔqseE, Δcra, ΔkdpE, ΔΔcrakdpE, and ΔfusK grown alone or in the presence of Bt (n = 9–15; error bars, s.d.; ***P < 0.001, **P < 0.01, P > 0.05 = ns). Each mutant has been normalized to 1 to show the fold-increase of the mutant when grown in the presence of Bt (+) Bt F, Representation of LEE pathogenicity island regulation.

