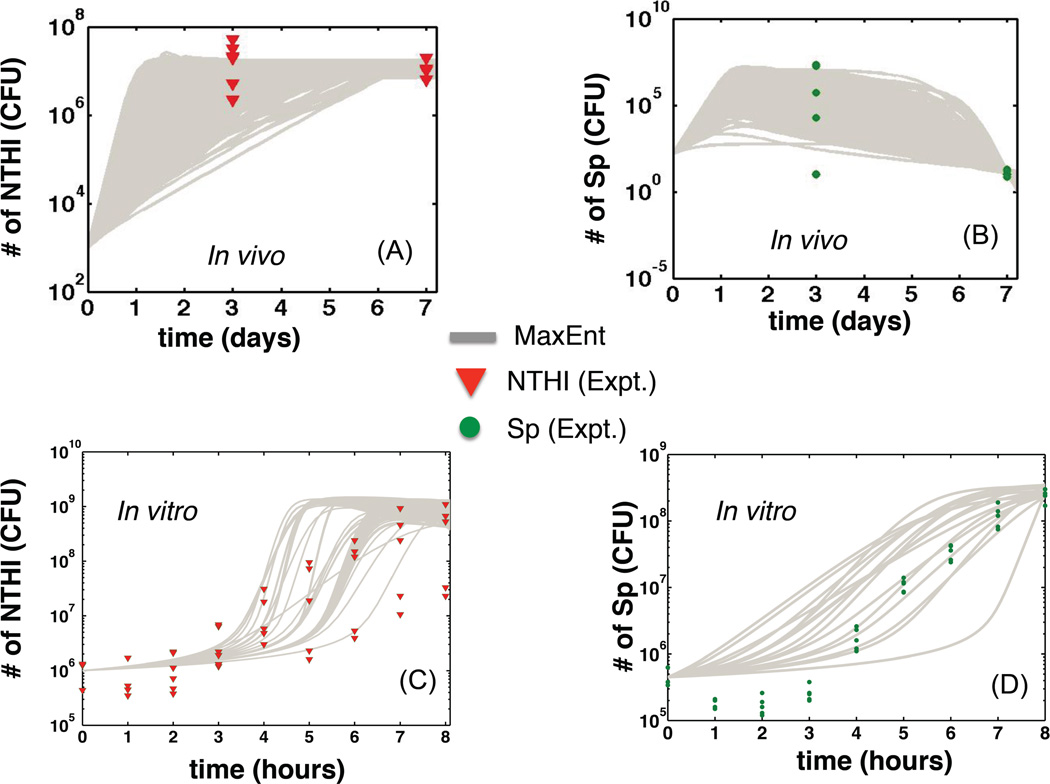
Fig. 1. Variations of bacterial kinetics between hosts and culture medium trials.
(A) The bacterial kinetics of “in silico” animals are shown with grey lines. An “in silico” animal is represented by a particular set of parameters in Table II that was drawn from the inferred MaxEnt distribution for the M+− model. The “in silico” animal was co-inoculated or was assigned with initial numbers of NTHI and Sp, and then Eqn(2) was solved with that initial condition to obtain the population kinetics of NTHI in the middle ear of the “in silico” animal. The in vivo experimental data (each red triangle corresponds to an individual chinchilla middle ear) were taken from Ref.(2) where the animals received inocula of ~103 CFU and ~150 CFU of NTHI and Sp, respectively. (B) Kinetics of Sp for the same set up as in (A) is shown using the same visualization scheme. The experimental data (in vivo) are shown using solid green circles. (C) Kinetics of NTHI (grey lines) generated by solving Eqn (S1) in individual trials in “in silico” culture experiments. Each “in silico” culture experiment is represented by a set of parameters in Table II, that was drawn from the inferred MaxEnt distribution for the M+0 model. The in vitro experimental data for each trial for the co-culture experiments with NTHI and Sp are shown in red triangles. (D) Kinetics of Sp for the same set up as in (C). The in vitro experimental data are shown in solid green circles.

