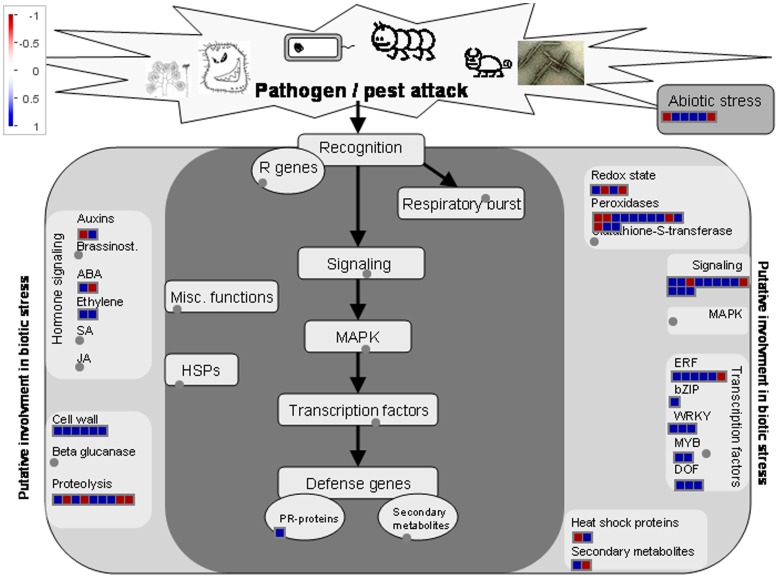
Figure 7.
Transcripts involved in stress responses. Transcript expression levels represented by log2 transformed RPKM values of ESP relative to ES, The color of each box represents the level of up/down regulation of each transcript. Red represents down-regulation, blue represents up-regulation. The number of transcripts in each gene family is equal to the number of boxes in each gene family. The relative expression is represented by color scales as indicated.

