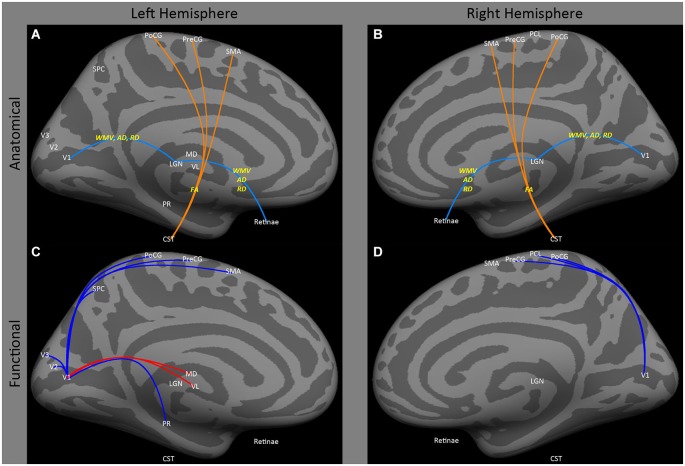
Figure 1.
Medial view of left and right hemispheres. The upper panels (A,B) are a summary of major findings from the human anatomical connectivity literature, as described in the main text. Increases in anatomical connectivity as a result of early blindness or anophthalmia are shown in orange; decreases in connectivity are shown in teal; types of anatomical measurements are shown in yellow. The lower panels (C,D) are a summary of major findings from the human functional correlations literature. Increases in functional correlations as a result of early blindness or anophthalmia are shown in red; decreases in functional correlations are shown in blue. Some lines represent findings from multiple studies. Explanations of abbreviations can be found in Section Abbreviations.

