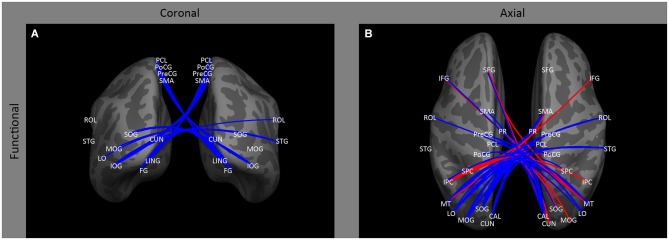
Figure 3.

Inter-hemispheric functional correlations. Coronal (A) and axial (B) views of inter-hemispheric functional correlations. Increases in functional correlations as a result of early blindness or anophthalmia are shown in red, decreases in functional correlations are shown in blue. Some lines represent findings from multiple studies.
