Figure 6.
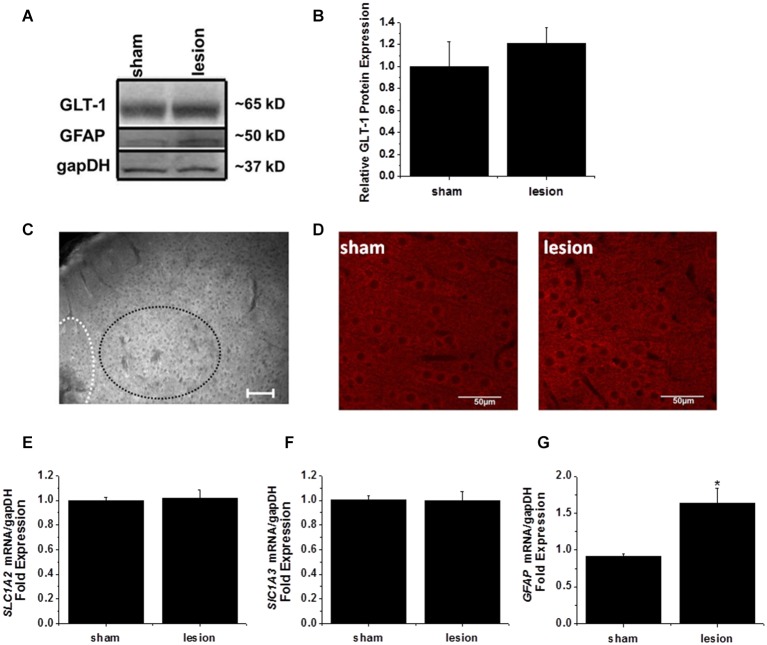
GLT-1 protein and mRNA expression levels were unchanged in the lesioned animals. (A) A representative Western blot demonstrating no change in GLT-1 expression in the hyperexcitable zone of lesioned tissue relative to tissue obtained from the same region in sham-operated animals. These blots were also stripped and re-probed with gapDH as a loading control and the astrocyte intermediate filament GFAP. (B) Plot of relative GLT-1 expression in lesioned tissue relative to control tissue. GLT-1 expression is normalized to the loading control gapDH. No significant difference was observed. (C) Wide field fluorescent microscopy was used to image the lesion, hyperexcitable zone and surrounding areas. No gross changes in GLT-1 expression were observed (scale bar = 100 µm). (D) Confocal imaging from a z-stack (60 sections, 1 µm/section) from the hyperexcitable region indicating GLT-1 immunoreactivity in a sham operated and lesioned animal (scale bar = 50 µm). (E) mRNA expression of GLT-1 (SLC1A2) was also unchanged in the hyperexcitable zone from lesioned animals when compared to tissue obtained from sham-operated animals (each sample ran in triplicate). (F) GLAST mRNA levels were not significantly different between groups. (G) GFAP expression was significantly elevated in the hyperexcitable zone (1.6 fold) relative to control tissue obtained from the same region.

