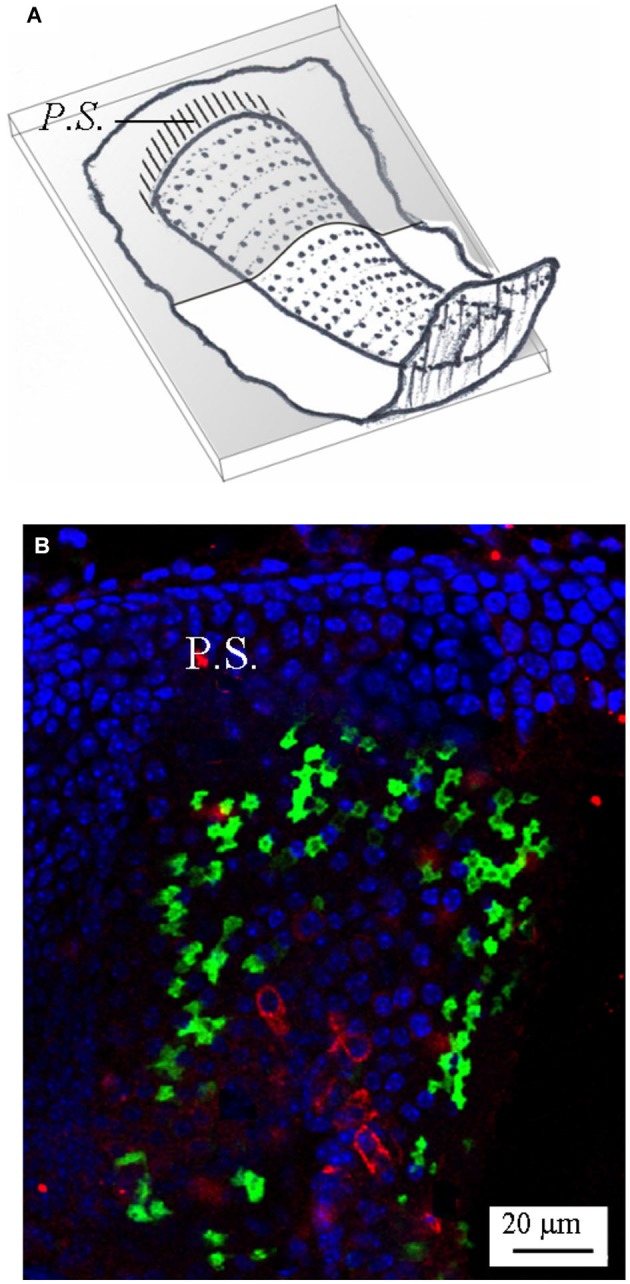
Figure 6.

Calbindin expression in the mouse horizontal crista. (A) Schematic representation showing the plane of the section. (B) Photomicrograph of a longitudinal confocal section showing the cell nuclei (blue; DAPI), GAD67 (green; GFP), and calbindin (red; antibody) expression—merged image. Note that most calbindin immunolabeling is concentrated in the central zone, where it marks several calyx endings.
