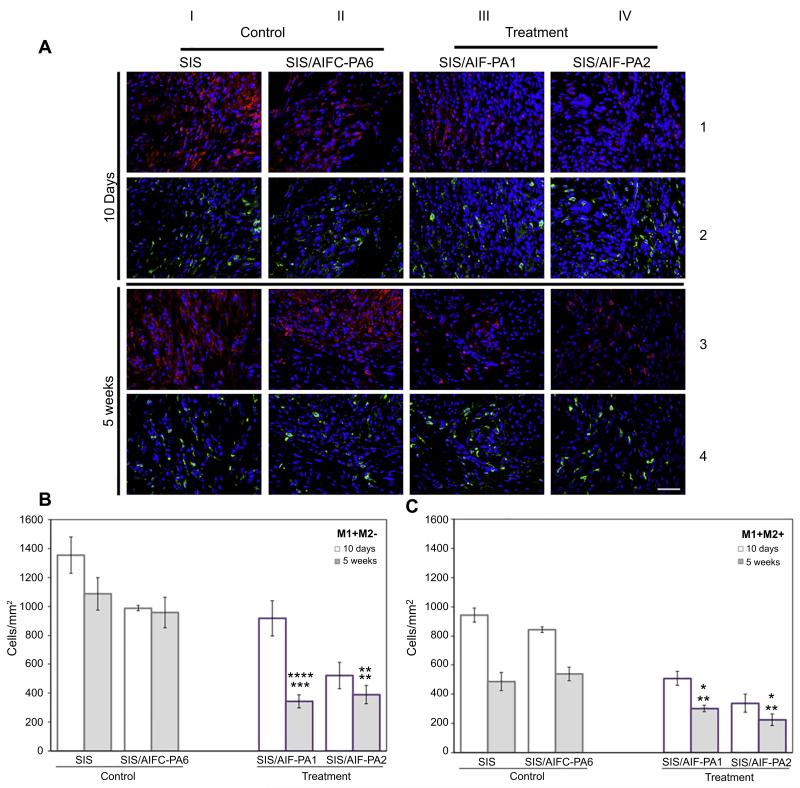
Fig. 3.
M1 and M2 macrophage characterization. (A) Dense populations of CD86+ M1 macrophages (red) were visualized at both time-points post-augmentation throughout the grafted area. This was accompanied by depressed levels of CD206+ M2 macrophages (green) of the control groups, most notably at 5W. Treatment groups saw a significant reduction in CD86+ M1 macrophage presence at 5W coupled with sustained expression of CD206+ M2 macrophages along the entirety of the graft. AIF-PA2 appeared to have a greater impact on macrophage populations than AIF-PA1. Blue, DAPI. Magnification is 400× (scale bar, 50 μm). (B) M1+ macrophages persisted at high levels in control groups while the SIS/AIF-PA1 treatment group demonstrated a significant decline over time. Data shown as means ± SE. Significance shown for comparison of SIS/AIF-PA1 and SIS/AIF-PA2 to SIS (top) and SIS/AIFC-PA6 (bottom); ****P < 0.0001, ***P < 0.001, **P < 0.01. (C) A general decrease in levels of M2+ macrophages was seen in both control and treatment groups at both time-points but M2+ macrophages were still abundant in treatment groups. Data shown as means ± SE. Significance shown for comparison of SIS/AIF-PA1 and SIS/AIF-PA2 to SIS (top) and SIS/AIFC-PA6 (bottom); ****P < 0.0001, **P < 0.01, *P < 0.05. (For interpretation of the references to colour in this figure legend, the reader is referred to the web version of this article.)

