
Figure 1.
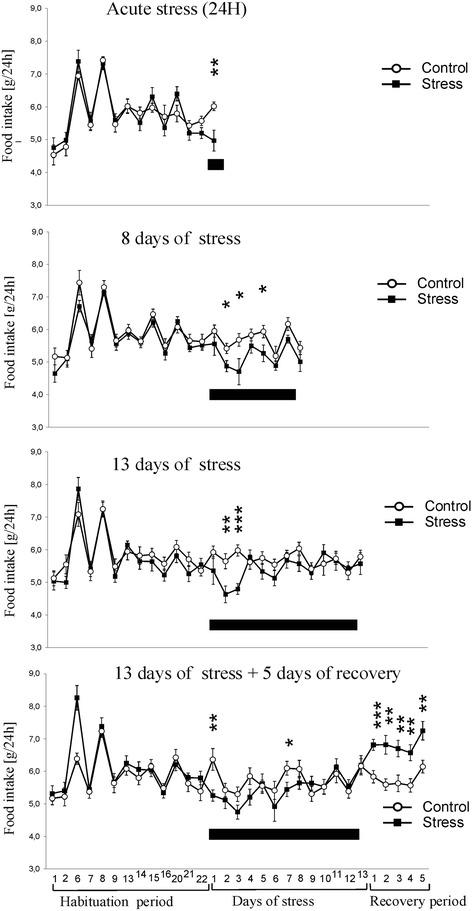
Effect of stress on food intake. Black bar depicts duration of social stress. Values are presented as mean ± SEM. N = 12, * - p < 0.05, ** - p < 0.01, *** - p < 0.001; compared with corresponding control group.
Official websites use .gov
A
.gov website belongs to an official
government organization in the United States.
Secure .gov websites use HTTPS
A lock (
) or https:// means you've safely
connected to the .gov website. Share sensitive
information only on official, secure websites.
Effect of stress on food intake. Black bar depicts duration of social stress. Values are presented as mean ± SEM. N = 12, * - p < 0.05, ** - p < 0.01, *** - p < 0.001; compared with corresponding control group.