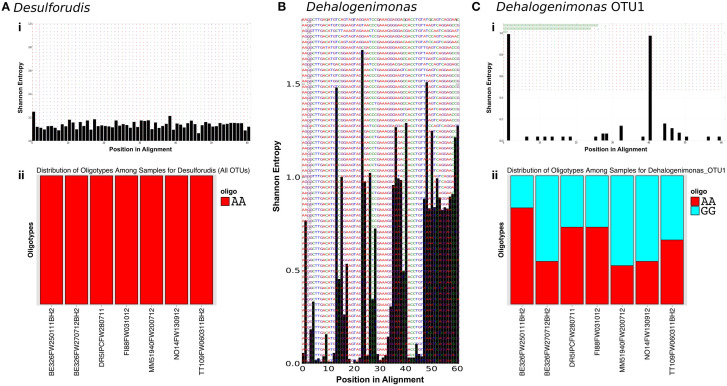
Figure 4.
Oligotypes of abundant genera. Entropy profiles for Desulforudis (Ai), Dehalogenimonas (B), and Dehalogenimonas OTU1 (Ci) are a discrete xy plot where the x-axis is the nucleotide position in the alignment and the y-axis is the calculated Shannon entropy for that position. Figures (Aii) and (Cii) display the relative abundance of the oligotypes observed. For Desulforudis, only one oligotype (AA) was observed while Dehalogenimonas revealed two oligotypes (AA, GG). The position of these distinctive nucleotides can be found in the entropy plot of (Ci). The elevated entropy at positions 1 and 40 reveal that these positions are where the single nucleotide changes occur.

