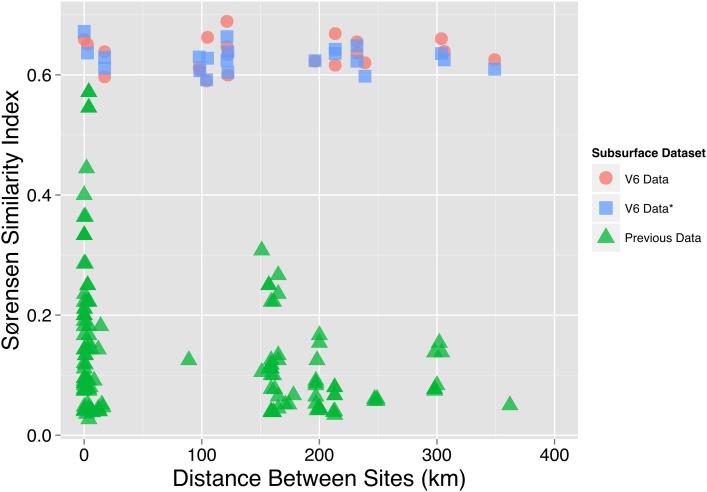
Figure 6.
Sørensen similarity index in relation to geographical distance. The OTU0.03 Sørensen similarity index (y-axis) of subsurface sites is shown in relationship to the geographical distance between the two sites used to calculate the Sørensen index (x-axis). The V6 data used in this study is displayed as both the Sørensen indices of the total subsurface OTU0.03 dataset (V6 Data, red circle) and a rarefied OTU0.03 Sørensen Index (V6 Data*, blue square). The rarefied OTU0.03 Sørensen index was calculated by averaging the result of 100 iterations of subsampling the OTU0.03 community data table to 85% of the smallest sample. A third set of OTU0.03 Sørensen similarity indices and distances (Previous Data, green triangle) was calculated from previous South African subsurface studies (Takai et al., 2001; Moser et al., 2003, 2005; Kieft et al., 2005; Gihring et al., 2006; Lin et al., 2006a,b; Borgonie et al., 2011; Chehoud, 2011).

