
Fig. 5.
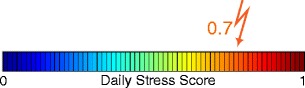
An example of the visualization of DSP for the class probabilities  =
= 
Official websites use .gov
A
.gov website belongs to an official
government organization in the United States.
Secure .gov websites use HTTPS
A lock (
) or https:// means you've safely
connected to the .gov website. Share sensitive
information only on official, secure websites.
An example of the visualization of DSP for the class probabilities =