
Figure 3. Endosomal escape and pH-dependent membrane disruption of fresh polyplexes.
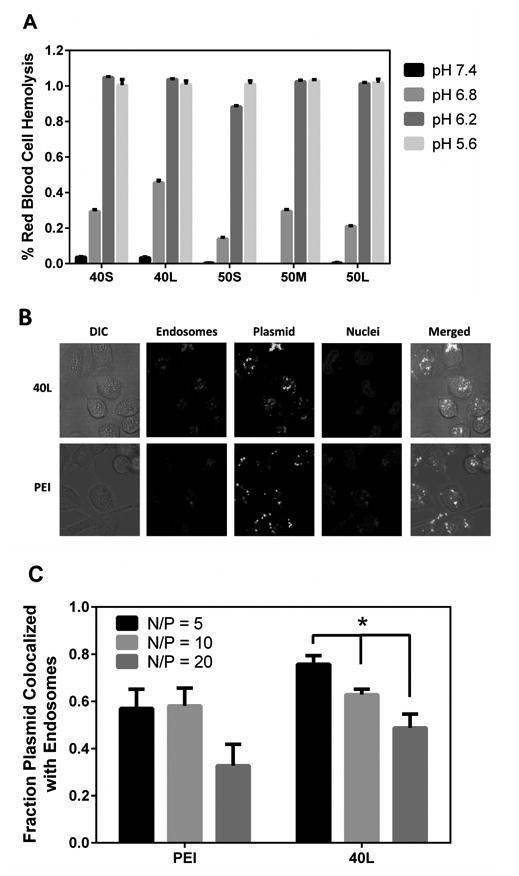
(A) pH-dependent red blood cell hemolysis assay. All polyplexes investigated exhibited pH-dependent membrane disruption, displaying minimal hemolysis at physiologic pH and switch-like transition into a membrane disruptive confirmation at endo-lysosomal pHs. Data are plotted as mean ± standard error. (B) Confocal microscopy images of MDA-MB-231 cells transfected with fresh 40L or PEI polyplexes with N/P ratio of 10 showing distribution of plasmid (green), endosomes (red), and nuclei (blue). (C) Percentage of plasmid colocalized with Lysotracker dye. Data are plotted as mean ± standard error, and the asterisk indicates statistically significant differences (p < 0.05).