
Figure 6. Aggregation kinetics of polyplexes in the presence of buffer salts, KCl, and serum.
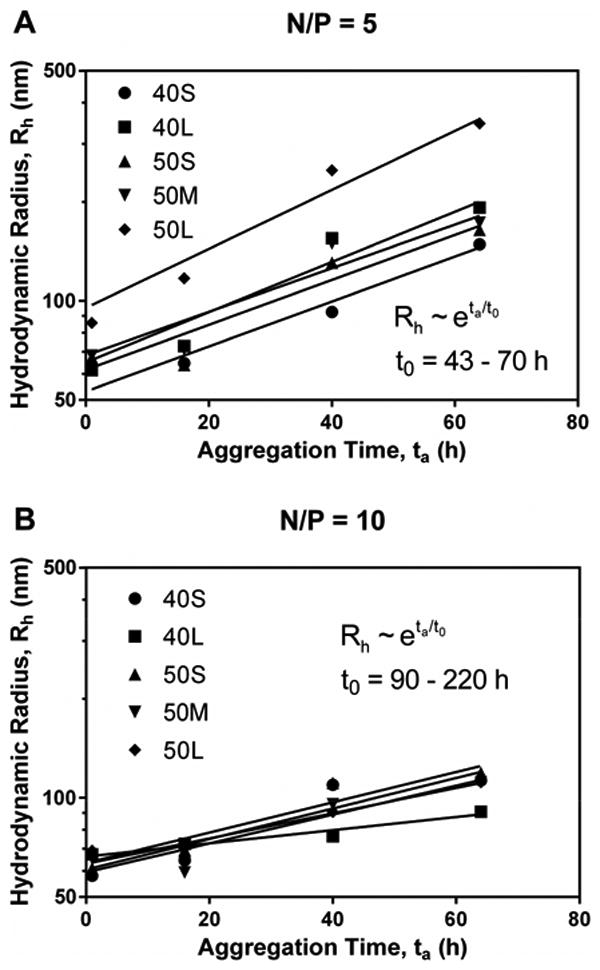
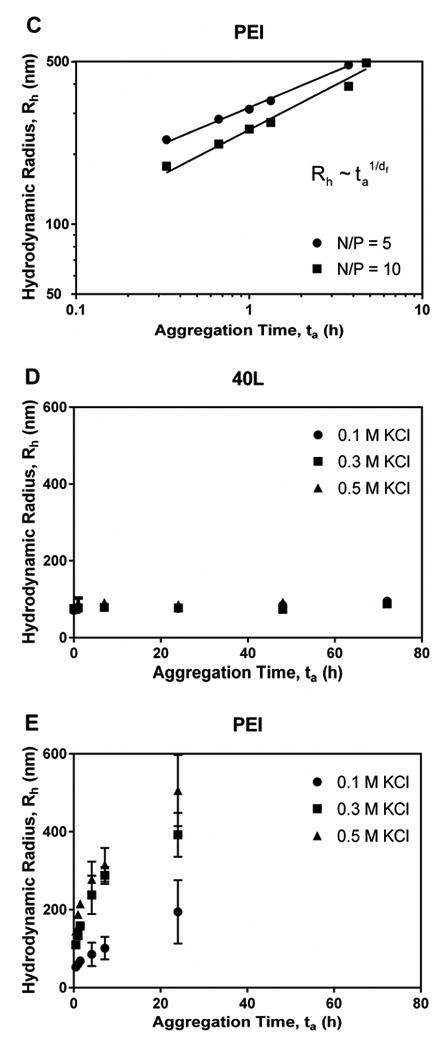
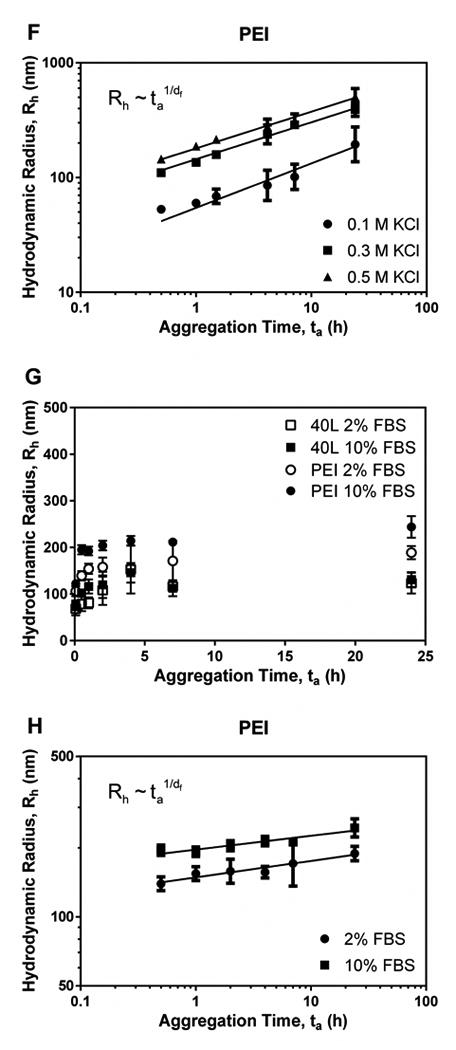
Panels A and B illustrate aggregation of fresh polyplexes with N/P ratio of 5 (A) and 10 (B) in DPBS over time. Data for diblock copolymers were fit to the reaction-limited colloidal aggregation model. (C) Data for PEI in DPBS were fit to the diffusion-limited colloidal aggregation model. Panels D and E show effects of ionic strength of KCl on aggregation of fresh 40L (D) and PEI (E) polyplexes. PEI polyplexes aggregated more quickly in solutions with higher ionic strength, while the size of 40L polyplexes was not affected by ionic strength. Data are plotted as mean ± standard deviation. (F) Data for PEI in KCl were fit to the diffusion-limited colloidal aggregation model. Panels G and H show the effects of serum concentration on aggregation of fresh 40L and PEI polyplexes with N/P ratio of 10. (G) Size of 40L and PEI polyplexes incubated in Opti-MEM + 2% or 10% FBS. (H) Data for PEI were fit to the diffusion-limited colloidal aggregation model. All data are plotted as mean ± standard deviation.