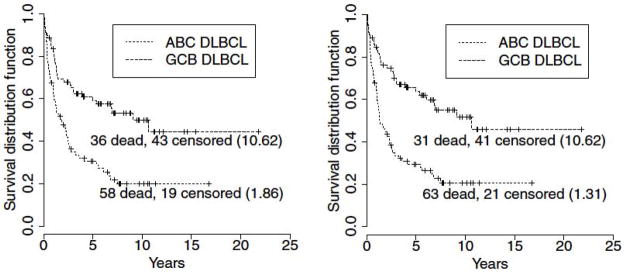
Fig. 5. Combined species data shows equivalent prognostic power with many fewer genes.

The panel on the left uses human gene expression data only (190 genes) to distinguish groups with different survival times; on the right, human and canine data are combined to produce a more focused gene list (21 genes) with equivalent power to predict survival in human DLBCL. Numbers in parentheses are median survival times, in years. Figure reproduced from Su et al. (92)
