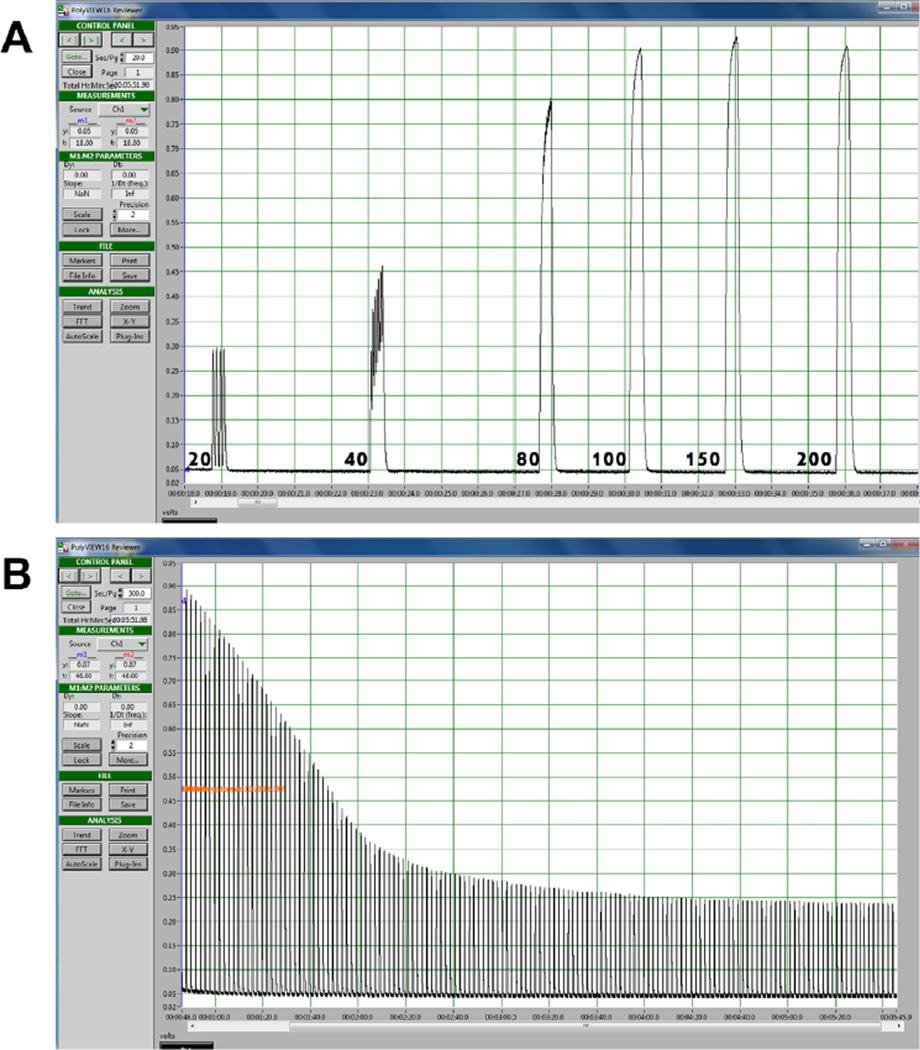
Figure 6. Sample tension data from in situ apparatus.
A. A screen shot display of typical data showing how a force-frequency curve is generated. Curves shown were produced from maximal contractions (200 ms duration) at incrementing higher frequencies in the quadriceps muscle in a rat. Note that maximal force is generated at ~150 Hz and diminishes with higher frequency. This optimal frequency can vary depending on the muscle group tested and the conditions (e.g., direct nerve stimulation as here versus field stimulation when muscles are removed for in vitro experiments, not shown here). B. One can also measure the decline in maximal isometric tetanic tension during repeated stimulation to assess fatigue. In this example, the quadriceps was isolated, adjusted to optimal length (Lo), and then stimulated with a 200 ms tetanic contraction once every second for 5 minutes.

