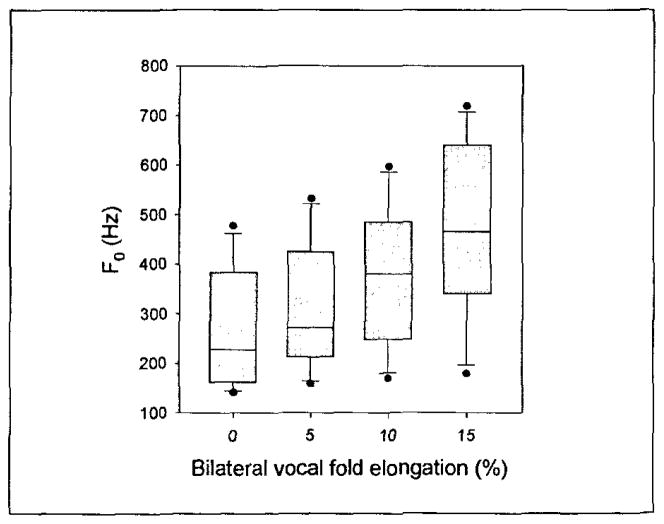
Figure 4.
Phonation threshold frequency of the samples. The upper and lower edges of the box represent the 75th and 25th, percentile, respectively, and a line within each box marks the median PTP for the given elongation level. Whiskers above and below each box represent the 90th and 10th percentiles, respectively. Statistical outliers are graphed as points.

