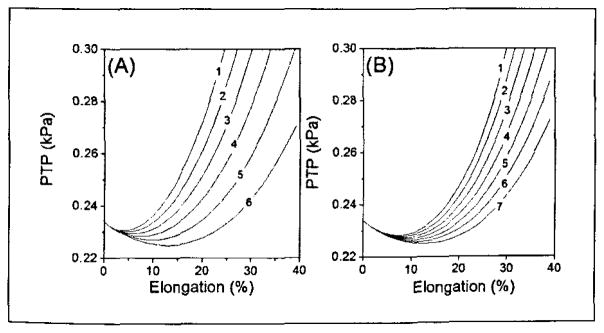
Figure 8.

The influence of the longitudinal stiffness parameters A and B on the PTP value. (a) The influence of the stiffness parameter A on the PTP value, where the parameter B is fixed at 3.47 and lines 1 through 6 correspond to A = 9.5, 8.5, 7.5, 6.5, 5.5, and 4.5, respectively. (b) The influence of the stiffness parameter B on the PTP value, where the parameter A is fixed at 4.5 and lines 1 7 correspond to B = 4.9, 4.7, 4.5, 4.3, 4.1, 3.9, 3.7, and 3.5, respectively.
