
Figure 2.
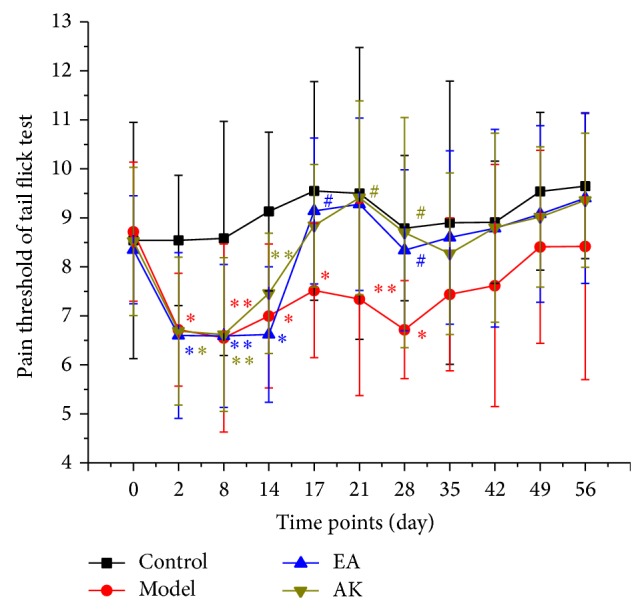
Effects of pain threshold on tail flick test in each group (n = 10 per group): control, model, EA, and AK. Compared with the control group, * P < 0.01, ** P < 0.05. Compared with the model group, # P < 0.05.
Official websites use .gov
A
.gov website belongs to an official
government organization in the United States.
Secure .gov websites use HTTPS
A lock (
) or https:// means you've safely
connected to the .gov website. Share sensitive
information only on official, secure websites.
Effects of pain threshold on tail flick test in each group (n = 10 per group): control, model, EA, and AK. Compared with the control group, * P < 0.01, ** P < 0.05. Compared with the model group, # P < 0.05.