Figure 3.

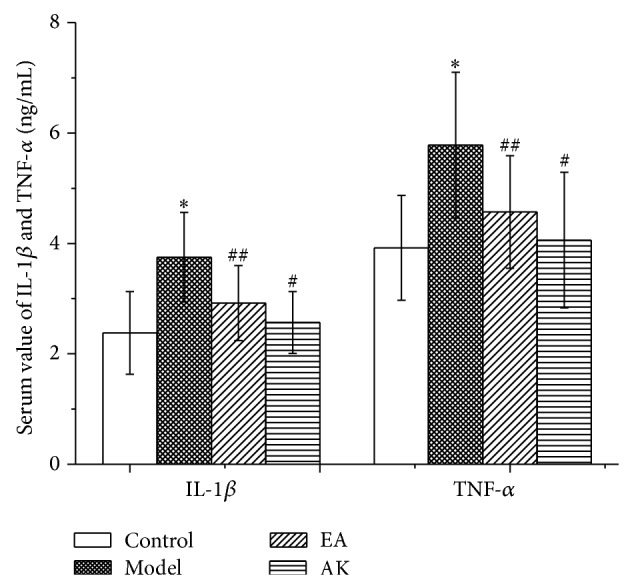
Effects of AK on IL-1β and TNF-α in peripheral blood in the following groups (n = 10 per group): control, model, EA, and AK. Compared with the control group, * P < 0.01; compared with the model group, # P < 0.01, ## P < 0.05.

Effects of AK on IL-1β and TNF-α in peripheral blood in the following groups (n = 10 per group): control, model, EA, and AK. Compared with the control group, * P < 0.01; compared with the model group, # P < 0.01, ## P < 0.05.