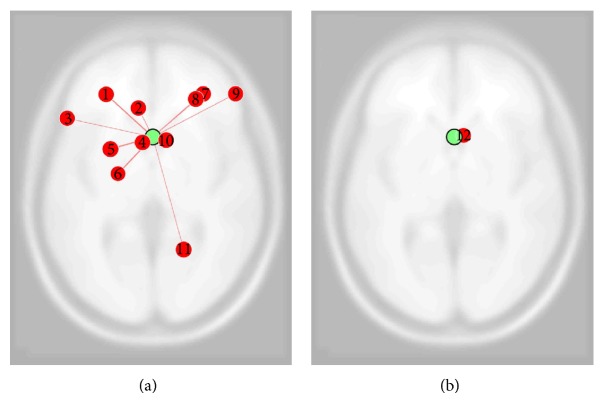
Figure 2.
Functional connectivity during sniffing for anosmic patients before (a) and after (b) the smell training performed over 12 weeks, overlaid on an axial template in MNI space (P = 0.01, uncorrected). The green dot represents the selected ROI (piriform cortex); the red dots capture the statistically significant functionally connected brain areas. (1) Dorsolateral prefrontal cortex (l). (2) Dorsal anterior cortex (l). (3) Inferior frontal gyrus (l). (4) Ventral anterior cortex (l). (5) Premotor cortex (l). (6) Posterior entorhinal cortex (l). (7) Dorsolateral prefrontal cortex (r). (8) Dorsal frontal cortex (r). (9) Dorsolateral prefrontal cortex (r). (10) Ventral anterior cortex (r). (11) Somatosensory association cortex (r). (12) Subgenual cortex (r).

