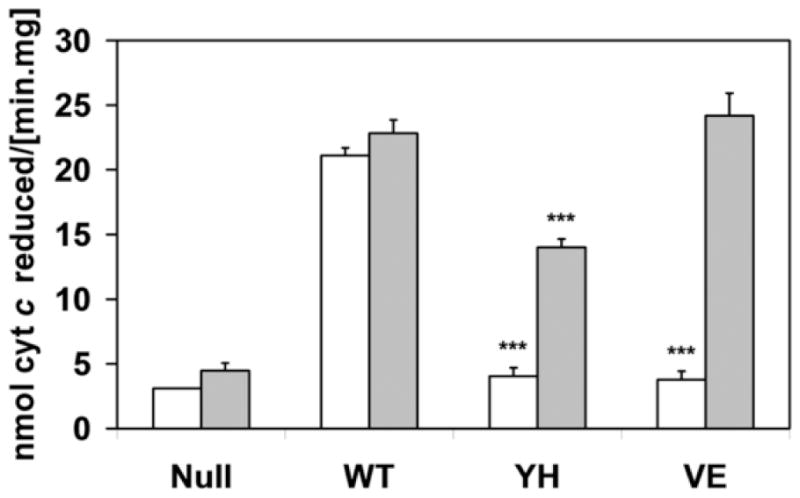
Fig. 2.

Histograms of cytochrome c reduction activity (in nmol cytochrome c reduced per min.mg membrane protein) of BTC1A2_POR membranes in the absence (white bars) or presence (gray bars) of 10 μM FAD. (Error bars represents the standard deviation to the mean of at least triplicate determination; statistical probability (p) is within the data-group, without or with FAD, relative to PORWT; ***: p<0.001;)
