
Fig. 4.
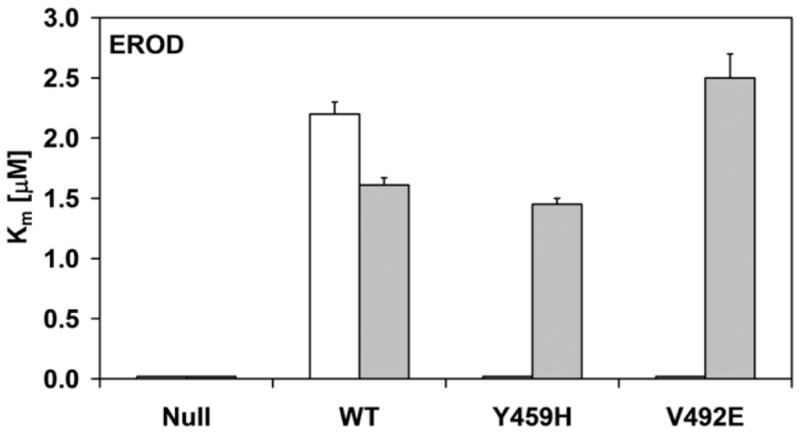
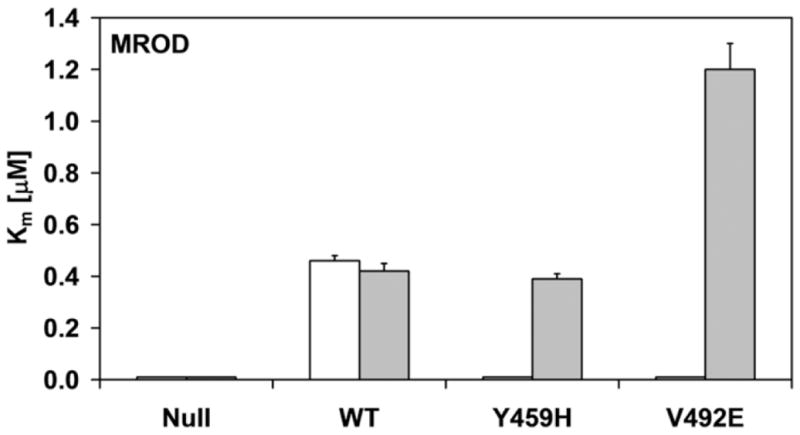
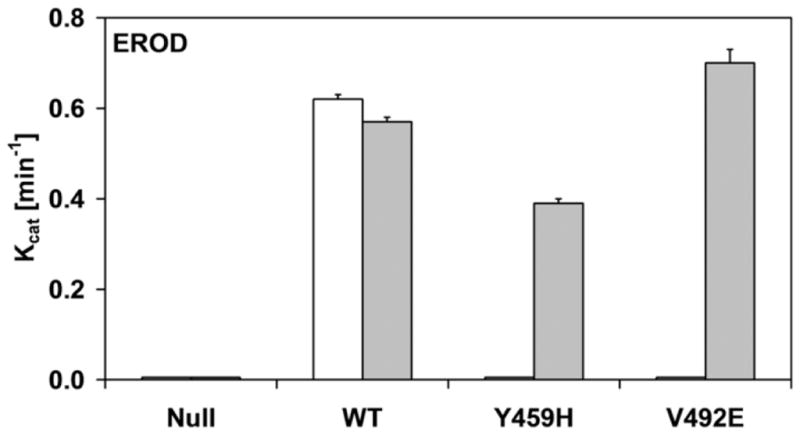
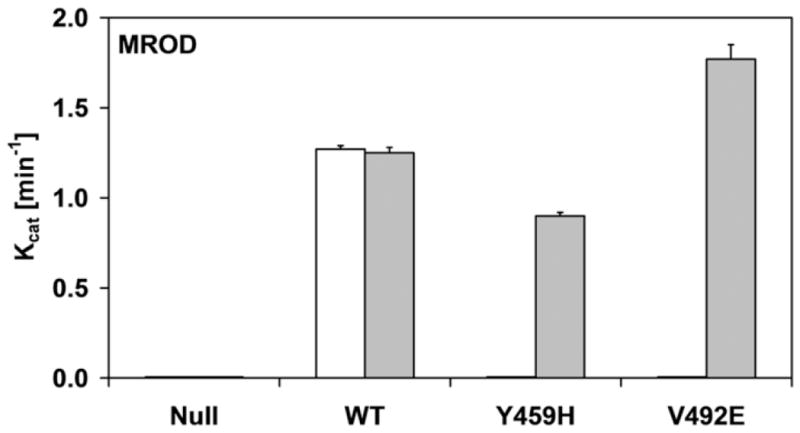
Histograms of the kinetic parameters of ethoxyresorufin-O-deethylation (a and c) and methoxyresorufin-O-demethylation (b and d) by BTC1A2_POR membranes, in absence or presence of 10 μM FAD. The affinity constant (Km) of CYP1A2 for ethoxyresorufin and methoxyresorufin are presented in a and b, respectively. The turnover number (kcat) of CYP1A2 for ethoxyresorufin and methoxyresorufin are presented in c and d, respectively (All Km and kcat values represented standard deviations (error-bars)< 10%, see Supplemental Table 1)