
Figure 4. MRI imaging studies.
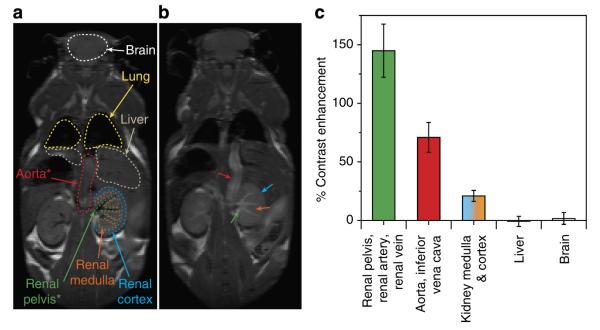
(a) MR image of whole mouse before OF1 injection with specific organs/tissues outlined for reference. Red asterisk: structure labeled as aorta could also include inferior vena cava. Green asterisk: structure labeled renal pelvis could also include renal artery and renal vein. (b) MR image of the same mouse 30 min after OF1 injection. (c) Quantitative analysis (mean±s.e.) of volume-average MR image contrast enhancement for four mice 30 min after OF1 injection. The values correlate with [spin] values obtained by EPR (vide Fig. 6).