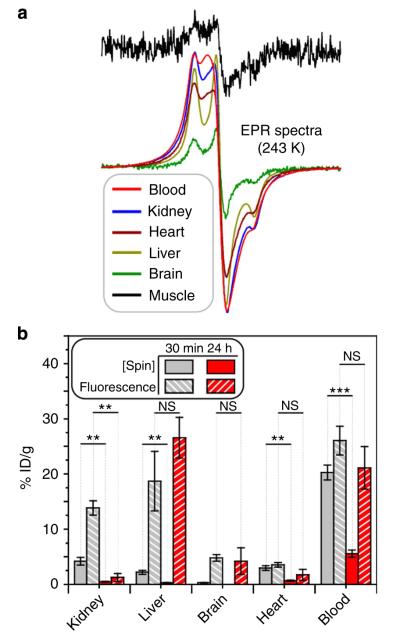
Figure 6. Ex vivo spin and fluorescence quantification.
(a) EPR spectra of blood and homogenized tissue samples. (b) Recovered fluorescence intensity and spin concentration in selected tissues. Error bars represent s.e.m. values obtained from four and three mice at 30 min and 24 h, respectively. Statistical comparisons were made with a student’s t-test: **P<0.01 and ***P<0.001. NS, not significant.

