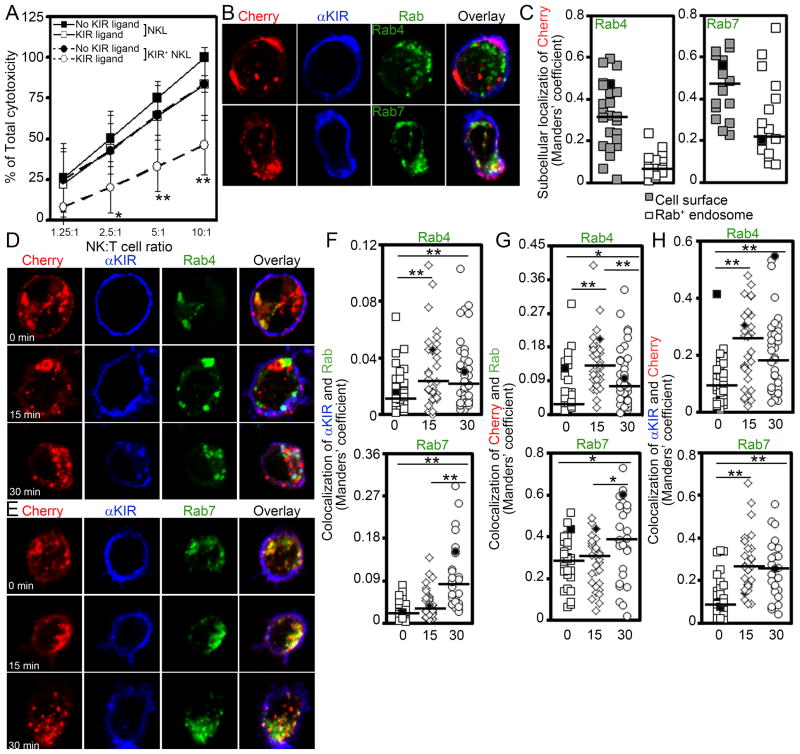
Figure 1. 3DL1 localizes to early and late endosomes after antibody engagement.
A. Non-radioactive colorimetric assay comparing the cytotoxicity of either KIR− (Squares; NKL) or 3DL1-Cherry+ NKL cells (Circles; KIR+ NKL) against 721.221 target cells lacking (No KIR ligand) or expressing the 3DL1 ligand HLA-B*051 (KIR ligand) at various NK cell:Target cell (NK:T) ratios. The mean ± S.D. of data from 5 independent experiments is shown. For each experiment, the data were first divided by the “NKL, No KIR ligand” sample (arbitrarily set to 100%) to generate the percentage of total cytotoxicity. Statistical analysis comparing matched samples for each NK cell line was calculated using the Student’s t test with * designating p ≤ 0.05 and ** defining p ≤ 0.01. B. 3DL1 and Rab4/Rab7 localization in representative NKL cells one day after IL-2 stimulation. Following fixation, cells expressing 3DL1-Cherry and either EYFP-Rab4 or EGFP-Rab7, were labeled with Brilliant Blue 421-conjugated DX9 (BV421-DX9). Shown are max-projected images of six 0.3 um slices through the center of representative individual cells. Cherry = 3DL1-Cherry (red); αKIR = Brilliant Blue 421-conjugated DX9 mAb bound to cell surface 3DL1 (blue); Rab4 = EYFP-Rab4 (green); Rab7 = EGFP-Rab7 (green). C. Compilation of data as in B. Thresholded Manders’ coefficients of 3DL1-Cherry colocalized with DX9 mAb (Cell surface), Rab4 (Rab4+ endosome) and Rab7 (Rab7+ endosome). The median of each data set is indicated by a horizontal bar. Data are pooled from 2 independent experiments where each icon represents a separate cell. Black filled icons designate values derived from the representative NK cells shown in panel B. D&E. Intracellular localization of 3DL1 with Rab4 (D) or Rab7 (E) are shown in representative NKL cells after 0–30 min exposure to DX9 mAb. 3DL1-Cherry+ NKL cells were stained with Brilliant Blue 421-conjugated DX9 mAb on ice to label the receptor at the cell surface and kept on ice (time 0) or incubated at 37°C for 15 or 30 min. Shown are max-projected images of six 0.3 μm slices through the center of representative individual cells. F–H. Compilation of data as in panel C. Thresholded Manders’ coefficients of DX9 mAb colocalized with Rab4 or Rab7 (F, top and bottom panels, respectively), 3DL1-Cherry colocalized with Rab4 and Rab7 (G, top and bottom panels, respectively) and DX9 mAb colocalized with 3DL1-Cherry in the same cell populations (H). Black filled icons designate values derived from the representative NK cells shown in panels D or E. Statistical analysis used the Wilcoxon Rank Sum test, where * designates p ≤ 0.05 and ** defines p ≤ 0.01. Data are pooled from 2 independent experiments where each icon represents a separate cell.

