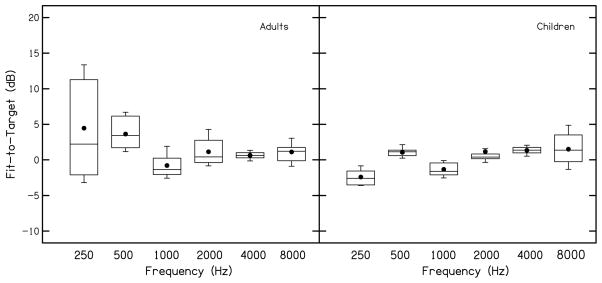
Figure 2.
Fit-to-target (difference between hearing aid output and Desired Sensation Level (DSL) target level for adults (left panel) and children (right panel)). Positive numbers indicate that the output was higher than the target level. For this and remaining box and whisker plots, boxes represent the interquartile range and whiskers represent the 10th and 90th percentiles. For each box, lines represent the median and filled circles represent the mean scores.

